 Global| Nov 29 2006
US 3Q GDP Growth Revised Up, Profits Firm
by:Tom Moeller
|in:Economy in Brief
Summary
U.S. real GDP growth for 3Q '06 was revised up to 2.2% (AR) from the advance estimate of just 1.6% growth. The revision exceeded Consensus estimates for a 1.8% increase. However, the rise in GDP last quarter still was the second [...]
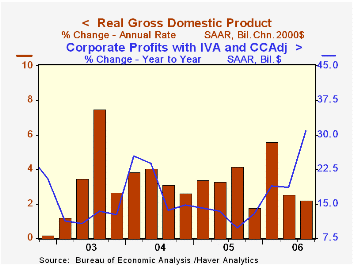
Despite slower growth in activity, corporate profitability rose a firm 4.2% (30.9% y/y) last quarter. (The comparison versus last year is exaggerated by the losses suffered due to Hurricane Katrina.) Nonfinancial corporate profits increased 8.2% (25.8% y/y) last quarter, a solid rebound from the 3.6% decline during 2Q. To the downside, however, were profits earned by US financial corporations which fell 0.5% (+62.7% y/y) and by foreign entities which fell 1.2% (+6.1% y/y).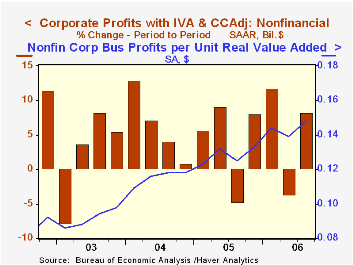
The upward revision to GDP growth mostly reflected reduced deterioration in the net export deficit to a 0.2 percentage point subtraction. Export growth was little changed at 6.3% (9.0% y/y) but the gain in imports was reduced to 5.3% (7.2% y/y).
Inventory accumulation also added 0.2 percentage points to GDP rather than subtracting slightly, as initially estimated.Residential investment was notably weak last quarter and fell a little revised 18.0% (AR, -7.9% y/y). It was the fourth consecutive decline, the largest since 1991 and sapped 1.2 percentage points from GDP growth last quarter. That subtraction was the largest by housing since 1981.
Growth in personal consumption was reduced slightly to 2.9% (2.7% y/y) but nonresidential fixed investment growth was increased to 10.0% (8.3% y/y). That was enough to leave the growth in final sales to domestic purchasers about unchanged at 2.1%.
Government expenditures were raised slightly to 2.2% (1.7% y/y) growth though the Federal government's spending on defense fell a deepened 1.1% (-1.2% y/y), the third decline in the last four quarters.
The GDP chain price index was unchanged at 1.8%, its weakest quarterly advance in over three years. The PCE chain price index grew 2.4% (2.8% y/y) which was slightly less than estimated earlier. Less food & energy the PCE chain price index grew 2.2% (2.4% y/y), a slowdown from a 2.7% rise during 2Q. The price index for residential investment fell 0.3% (+3.2% y/y), the first decline since early 2002.
Historic Imbalances and Great Debates: Do The Economists See It Coming? from the Federal Reserve Bank of Boston is available here.
| Chained 2000$, % AR | 3Q '06 (Prelim.) | 3Q '06 (Advance) | 2Q '06 | Y/Y | 2005 | 2004 | 2003 |
|---|---|---|---|---|---|---|---|
| GDP | 2.2% | 1.6% | 2.6% | 3.0% | 3.2% | 3.9% | 2.5% |
| Inventory Effect | 0.2% | -0.1% | 0.4% | 0.6% | -0.3% | 0.4% | 0.0% |
| Final Sales | 2.1% | 1.7% | 2.1% | 2.4% | 3.5% | 3.5% | 2.5% |
| Foreign Trade Effect | -0.2% | -0.6% | 0.4% | 0.0% | -0.1% | -0.5% | -0.3% |
| Domestic Final Demand | 2.1% | 2.2% | 1.6% | 2.4% | 3.6% | 4.0% | 2.8% |
| Chained GDP Price Index | 1.8% | 1.8% | 3.3% | 2.9% | 3.0% | 2.8% | 2.1% |
by Tom Moeller November 29, 2006
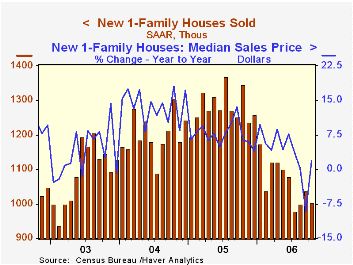
Sales of new single family homes fell 3.7% to 1.004M during October and reversed all of a downwardly revised gain the prior month. The decline exceeded expectations for stability near 1.050M.
Moving in the other direction, the median sales price of a new single family home jumped 13.9% to $249,500 and more than reversed the prior month's decline.
New home sales during the first ten months of this year are down 17.2% from the first ten months of 2005.
Sales rose m/m only (slightly) in the West (-35.5% y/y). In the Northeast sales fell by 39.0% (-52.6% y/y) to the lowest level since 1995. In the Midwest sales fell as well (-26.5% y/y and down South sales fell moderately m/m (-15.4% y/y).
The number of new homes for sale fell for the third consecutive month (+13.9% y/y). The year to year breakdown by region is as follows: Northeast, 22.7%; West, 19.2%; South, 18.6%; Midwest, -2.8%.
| U.S. New Homes | October | September | Y/Y | 2005 | 2004 | 2003 |
|---|---|---|---|---|---|---|
| Total Sales (AR, 000's) | 1,004 | 1,037 | -25.4% | 1,280 | 1,201 | 1,091 |
| Median Price (NSA) | $248,500 | $218,200 | 1.9% | $234,208 | $217,817 | $191,383 |
by Tom Moeller November 29, 2006
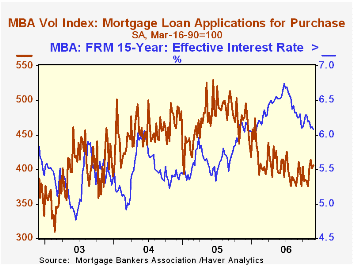
The total number of mortgage applications repeated the prior period's decline and fell 3.9% last week, according to the Mortgage Bankers Association.
Last week's decline was due to a collapse in applications to refinance which doubled the prior week's drop and fell 9.6%.The decline reversed the gains logged earlier in November.
Purchase applications recovered about half of the prior week's decline with a 1.3% increase. On average, November purchase applications rose 6.4% from the October level. Purchase applications fell 3.6% last month from September on average.
During the last ten years there has been a 58% correlation between the y/y change in purchase applications and the change in new plus existing single family home sales.
The effective interest rate on a conventional 30-year mortgage was unchanged at 6.32%. The peak for 30 year financing was 7.08% late in June. The rate for 15-year financing, however, slipped to 6.08%. The peak for 15 year financing was 6.75% during June. Interest rates on 15 and 30 year mortgages are closely correlated (>90%) with the rate on 10 year Treasury securities.
During the last ten years there has been a (negative) 79% correlation between the level of applications for purchase and the effective interest rate on a 30-year mortgage.
The Mortgage Bankers Association surveys between 20 to 35 of the top lenders in the U.S. housing industry to derive its refinance, purchase and market indexes. The weekly survey covers roughly 50% of all U.S. residential mortgage applications processed each week by mortgage banks, commercial banks and thrifts. Visit the Mortgage Bankers Association site here.
| MBA Mortgage Applications (3/16/90=100) | 11/17/06 | 11/10/06 | Y/Y | 2005 | 2004 | 2003 |
|---|---|---|---|---|---|---|
| Total Market Index | 599.0 | 623.6 | -4.0% | 708.6 | 735.1 | 1,067.9 |
| Purchase | 406.7 | 401.4 | -14.6% | 470.9 | 454.5 | 395.1 |
| Refinancing | 1,749.6 | 1,935.3 | 17.9% | 2,092.3 | 2,366.8 | 4,981.8 |
by Carol Stone November 29, 2006

Industrial production in Japan surged in October by 1.6%, more than reversing a 0.7% setback in September. Analysts polled by major press services had looked for September's decline to be repeated in October by 0.4% or 0.5%, so the result was a major surprise.
Gains were widespread, particularly among durable goods industries. Metals and machinery of various kinds all had sizable increases, as suggested by the selection in the table below. General machinery halted a three-month decline with a substantial 6.5% jump which brought it 10.8% above a year ago. Semiconductors and other electronics rose 2.8% in October, putting the volume of those industries' output a whopping 18.9% above October 2005.
Clearly, not all industries participated, with petroleum and related sectors showing some weakness. Petroleum refining and processing itself has fallen markedly, down 3.6% in October and 8.0% on the year-ago amount. Chemicals (excluding drugs) have been off modestly three months running, carrying them down 0.2% from a year ago. Textiles and ceramic products were also down. Plastics, paper, rubber and furniture all were little changed.
Nonetheless, the outsized increases in some key industries are striking. Analysts have been divided over whether the Japanese economy was ready to bear higher interest rates, and these results give further credibility to the Bank of Japan's general stance in that direction. Notably in this report, the main push was in capital goods; excluding transportation equipment, output in those industries jumped 10.1% in the month. Production in these sectors is by nature volatile, so long-range conclusions can't be drawn from the one-month move, but it points toward a firm economy, not a soft one, as had been hinted in other recent data.
| JAPAN, Seas Adj* | Oct 2006 | Sept 2006 | Aug 2006 | Year Ago | 2005 | 2004 | 2003 |
|---|---|---|---|---|---|---|---|
| Headline Series, 2000=100 | 107.8 | 106.1 | 106.8 | 101.6 | 101.3 | 100.2 | 95.0 |
| % Change | 1.6 | -0.7 | 1.8 | 7.4 | 1.1 | 5.5 | 3.2 |
| General Machinery | 6.5 | -1.6 | -0.2 | 10.8 | 5.2 | 16.7 | 7.2 |
| Electronic Parts, Etc | 2.8 | -0.5 | 5.0 | 18.9 | 0.8 | 13.3 | 17.8 |
| Chemicals (ex Drugs) | -0.4 | -0.9 | -1.4 | -0.2 | 0.6 | 1.4 | 1.6 |
| Petroleum & Products | -3.6 | -1.5 | 0.9 | -8.0 | 1.2 | -1.1 | 1.8 |

Tom Moeller
AuthorMore in Author Profile »Prior to joining Haver Analytics in 2000, Mr. Moeller worked as the Economist at Chancellor Capital Management from 1985 to 1999. There, he developed comprehensive economic forecasts and interpreted economic data for equity and fixed income portfolio managers. Also at Chancellor, Mr. Moeller worked as an equity analyst and was responsible for researching and rating companies in the economically sensitive automobile and housing industries for investment in Chancellor’s equity portfolio. Prior to joining Chancellor, Mr. Moeller was an Economist at Citibank from 1979 to 1984. He also analyzed pricing behavior in the metals industry for the Council on Wage and Price Stability in Washington, D.C. In 1999, Mr. Moeller received the award for most accurate forecast from the Forecasters' Club of New York. From 1990 to 1992 he was President of the New York Association for Business Economists. Mr. Moeller earned an M.B.A. in Finance from Fordham University, where he graduated in 1987. He holds a Bachelor of Arts in Economics from George Washington University.
More Economy in Brief


