 Global| Dec 21 2006
US 3Q GDP Growth Revised Lower
by:Tom Moeller
|in:Economy in Brief
Summary
U.S. real GDP growth last quarter was revised down to 2.0% (AR). The estimate had started at 1.6% then was raised to 2.2% last month and compared to Consensus expectations for no change at 2.2%. The rise in GDP last quarter was the [...]
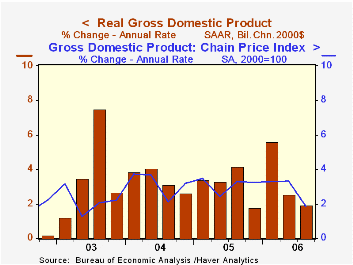
U.S. real GDP growth last quarter was revised down to 2.0% (AR). The estimate had started at 1.6% then was raised to 2.2% last month and compared to Consensus expectations for no change at 2.2%. The rise in GDP last quarter was the second slowest quarterly growth rate since 1Q 2003.
Expectations for growth this quarter call for further slowdown then improvement to 3.0% GDP growth next year. Economic forecasts from Macroeconomic Advisors are available in the Haver DLX database MA4CAST.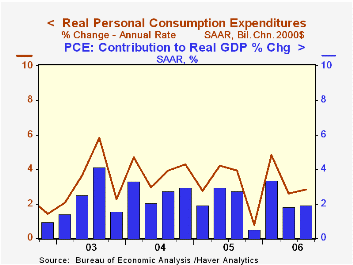
Growth in corporate profitability was revised slightly lower to still-firm 3.9% (30.6% y/y) from the 4.2% gain estimated initially. (The comparison versus last year is exaggerated by the losses suffered due to Hurricane Katrina.) The downward revision was due to a lowered figure for profits earned by US financial corporations which fell 1.9% (+60.4% y/y) and a deepened decline in profits earned by foreign entities which fell 2.2% (+5.0% y/y). U.S. nonfinancial corporate profitability was revised up slightly to 8.7% (26.4% y/y).
Less inventory accumulation contributed to the downward GDP revision for 3Q and it added 0.1 percentage points to GDP rather than the 0.2 point add estimated last month.
Overall growth in final sales to domestic purchasers was reduced slightly to 2.0%. Growth in personal consumption was reduced slightly to 2.8% (2.7% y/y) and nonresidential fixed investment growth was held steady at 10.0% (8.3% y/y).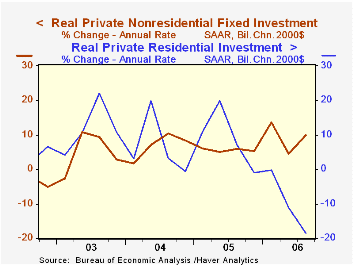
Residential investment was even weaker than indicated earlier and the 3Q estimate was revised slightly down to -18.6% (AR, -8.1% y/y). It was the fourth consecutive decline, the largest since 1991 and pulled 1.2 percentage points from 3Q GDP growth. That subtraction was the largest by housing since 1981.
Deterioration in the net export deficit was left unchanged at a 0.2 percentage point subtraction from GDP growth. Export growth was upwardly revised slightly to 6.8% (9.1% y/y) and import growth also was revised up slightly to 5.6% (7.2% y/y).
The GDP chain price index was revised up slightly to 1.9%, its weakest quarterly advance in over three years. The PCE chain price index grew an unrevised 2.4% (2.8% y/y). Less food & energy the PCE chain price index grew 2.3% (2.4% y/y).
Milton Freidman on Inflation from the Federal Reserve Bank of St. Louis is available here.
| Chained 2000$, % AR | 3Q '06 (Final) | 3Q '06 (Prelim.) | 2Q '06 | Y/Y | 2005 | 2004 | 2003 |
|---|---|---|---|---|---|---|---|
| GDP | 2.0% | 2.2% | 2.6% | 3.0% | 3.2% | 3.9% | 2.5% |
| Inventory Effect | 0.1% | 0.2% | 0.4% | 0.7% | -0.3% | 0.4% | 0.0% |
| Final Sales | 1.9% | 2.1% | 2.1% | 2.3% | 3.5% | 3.5% | 2.5% |
| Foreign Trade Effect | -0.2% | -0.2% | 0.4% | -0.1% | -0.1% | -0.5% | -0.3% |
| Domestic Final Demand | 2.0% | 2.1% | 1.6% | 2.4% | 3.6% | 4.0% | 2.8% |
| Chained GDP Price Index | 1.9% | 1.8% | 3.3% | 2.9% | 3.0% | 2.8% | 2.1% |
by Tom Moeller December 21, 2006
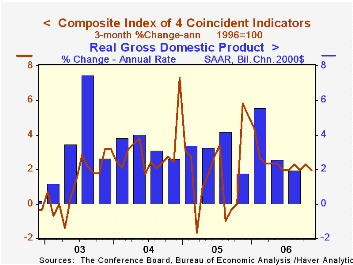
According to the Conference Board, the composite index of leading economic indicators edged up 0.1% last month, the same as during October which was downwardly revised. The increase in November marked the third consecutive monthly increase, the first string of three months gain since the Spring of 2005. Consensus expectations for November had been for no change.
During the last ten years there has been a 59% correlation between the y/y change in the leading indicators and the lagged change in real GDP.
The breadth of one month gain amongst the 10 components of the leading index reversed the prior month's improvement and fell to 40%, but over the last six months 55% of the component series rose.
A rising money supply, improved vendor performance and higher capital goods orders accounted for much of last month's gain in the leading index. That was offset by lower building permits, higher claims for jobless insurance and easier consumer expectations.
The method of calculating the contribution to the leading index from the spread between 10 year Treasury securities and the Fed funds rate has been revised. A negative contribution will now occur only when the spread inverts rather than when declining as in the past. More details can be found here.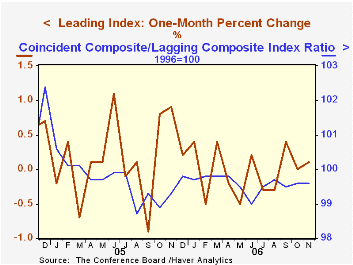
The leading index is based on eight previously reported economic data series. Two series, orders for consumer goods and orders for capital goods, are estimated.
The coincident indicators increased 0.2% after an upwardly revised 0.2% increase during October. Over the last ten years there has been a 91% correlation between the y/y change in the coincident indicators and real GDP growth.
The lagging indicators rose a solid 0.5%, the largest increase since June. The ratio of coincident to lagging indicators, which is a measure of actual economic performance versus excess, was unchanged. The ratio has been stuck at the current level since since July.
Visit the Conference Board's site for coverage of leading indicator series from around the world.
| Business Cycle Indicators | November | October | Y/Y | 2005 | 2004 | 2003 |
|---|---|---|---|---|---|---|
| Leading | 0.1% | 0.1% | 0.0% | 2.3% | 7.4% | 5.0% |
| Coincident | 0.2% | 0.2% | 2.3% | 2.2% | 2.5% | 0.4% |
by Tom Moeller December 21, 2006
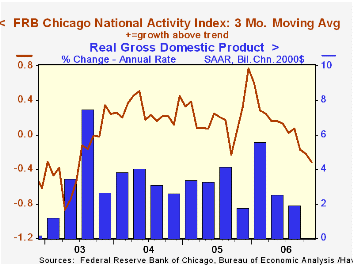
The National Activity Index (CFNAI) from the Federal Reserve Bank of Chicago remained negative in November at -0.26. The figure was negative for the fifth month in the last seven. The three-month moving average of the CFNAI fell to -0.32, its lowest level since 2003.
A zero value of the CFNAI indicates that the economy is expanding at its historical trend rate of growth and during the last twenty years there has been a 68% correlation between the level of the CFNAI and q/q growth in real GDP.
The CFNAI is a weighted average of 85 indicators of economic activity. The indicators reflect activity in the following categories: production and income, the labor market, personal consumption and housing, manufacturing and trade sales, and inventories & orders.
The complete CFNAI report is available here.
The latest Survey of Professional Forecasters from the Federal Reserve Bank of Philadelphia is available here.
| Chicago Fed | November | October | November '05 | 2005 | 2004 | 2003 |
|---|---|---|---|---|---|---|
| CFNAI | -0.26 | -0.30 | 0.88 | 0.21 | 0.30 | -0.17 |
by Tom Moeller December 21, 2006
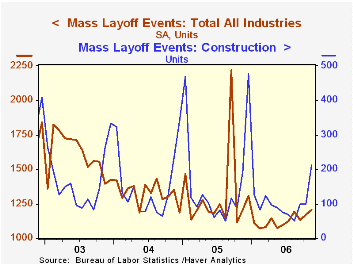
The number of mass layoff events rose 3.2% in November for the fifth increase in the last six months. That was enough to lift the number of layoff events to the highest level of 2006.
During the last ten years there has been a (negative) 85% correlation between the three month average level of layoff announcements and the y/y change in payroll employment.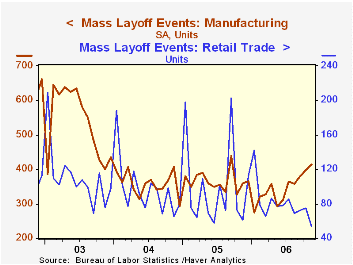
The number of persons affected last month by mass layoffs surged 20.0% m/m, also to the highest level of the year. Nevertheless, the number of persons affected by mass layoffs during the first eleven months of this year fell 17.6% from the first eleven months of 2005.
Increased layoffs in construction (10.4% y/y) and manufacturing (15.6% y/y) accounted for much of the recent increase while the number of layoff events in retail (-11.5% y/y) and information (-4.8% y/y) fell.
The Mass Layoff Statistics (MLS) program collects reports on mass layoff actions that result in workers being separated from their jobs. Monthly mass layoff numbers are from establishments which have at least 50 initial claims for unemployment insurance (UI) filed against them during a 5-week period.
| Mass Layoffs | November | October | Y/Y | 2005 | 2004 | 2003 |
|---|---|---|---|---|---|---|
| All US Industries (# Events, SA) | 1,208 | 1,171 | 0.2% | 15,699 | 15,926 | 19,220 |
| Total (# Persons, SA) | 135,415 | 113,724 | 12.9% | 1,722,452 | 1,591,081 | 1,946,548 |
by Tom Moeller December 21, 2006
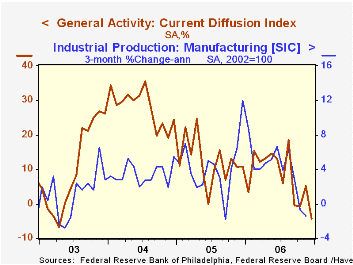
The Philadelphia Federal Reserve Bank's Index of General Business Conditions in the manufacturing sector fell and was negative for the third month in the last four. The December reading of -4.3 was the lowest since early 2003 and compared to Consensus expectations for just a slight decline to +3.5.
During the last ten years there has been a 65% correlation between the level of the Philadelphia Fed Business Conditions Index and three month growth in factory sector industrial production. There has been a 43% correlation with q/q growth in real GDP.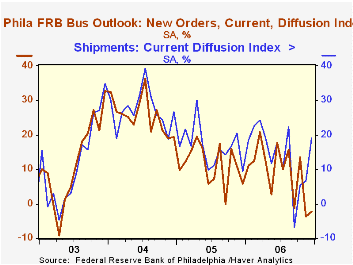
The sub indexes for unfilled orders, delivery times and inventories accounted for much of the total's decline. New orders improved to a less negative reading and shipments surged. The employment index also improved. During the last ten years there has been a 75% correlation between the employment index and the three month growth in factory payrolls.
The business conditions index reflects a separate survey question, not the sub indexes.
The prices paid index fell to the lowest level since March. During the last ten years there has been a 76% correlation between the prices paid index and the three month growth in the intermediate goods PPI. There has been an 85% correlation with the change in core intermediate goods prices.
The separate index of expected business conditions in six months nearly halved m/m and fell to the lowest level since August.
The latest Business Outlook survey from the Philadelphia Federal Reserve Bank can be found here.
| Philadelphia Fed Business Outlook | December | November | Dec. '05 | 2006 | 2005 | 2004 |
|---|---|---|---|---|---|---|
| General Activity Index | -4.3 | 5.1 | 10.9 | 8.0 | 12.4 | 28.0 |
| Prices Paid Index | 20.6 | 26.7 | 47.1 | 36.6 | 43.5 | 51.2 |
by Tom Moeller December 21, 2006
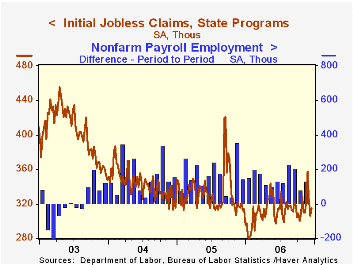
Initial unemployment insurance claims increased 9,000 last week to 315,000 and reversed half of the revised decline during the prior week. The increase matched Consensus expectations.
The latest figure covers the December survey period for nonfarm payrolls and claims fell 8,000 (-2.5%) from the November period.
During the last ten years there has been a (negative) 77% correlation between the level of initial claims and the m/m change in nonfarm payroll employment.
The four-week moving average of initial claims fell to 325,750 (+2.9% y/y).
Continuing claims for unemployment insurance rose 45,000 and reversed all of the prior week's decline.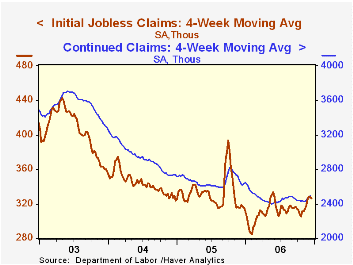
The insured rate of unemployment remained at 1.9% for the seventh consecutive week and equaled the average rate since February.
Interest Rates, Carry Trades, and Exchange Rate Movements from the Federal Reserve Bank of San Francisco can be found here.
| Unemployment Insurance (000s) | 12/16/06 | 12/09/06 | Y/Y | 2005 | 2004 | 2003 |
|---|---|---|---|---|---|---|
| Initial Claims | 315 | 306 | 1.0% | 332 | 343 | 403 |
| Continuing Claims | -- | 2,520 | -3.7% | 2,662 | 2,924 | 3,532 |
by Carol Stone December 21, 2006

We expressed concern just a few weeks ago here about the whether the Canadian economy might be entering a slowdown. Our discussion of Q3 GDP indicated just scattered evidence, but our edginess increased due to an outright contraction in the monthly GDP for September that Statistics Canada calculates from industry data.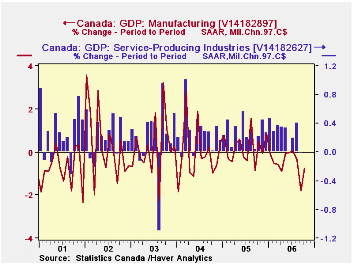
In today's report, the September figure was revised lower, now showing a 0.4% decline instead of the 0.3% reported initially. Then in October, there was almost no movement at all. The total was down a minuscule C$160 million, a change of 0.01%. This was almost exactly divided between good-producing and service-producing sectors, which fell C$80 million and C$79 million, respectively. Among the goods-producing industries, manufacturing is undergoing an active contraction, with declines of 1.8% in September and 0.8% and October; its activity is running 4.2% below last October.
Services are seeing a kind of bifurcated performance, with weakness in those sectors related to the distribution of goods -- wholesale and retail trade, transportation, etc. -- and continuing growth in the purer service areas, such as finance and health care. The pattern in arts, recreation and travel-related has been interesting: those industries were weak back in the summer, but picked up nicely beginning in August. This was the time when gasoline prices turned down, and we wonder if the relief there gave a boost to late summer and autumn recreation.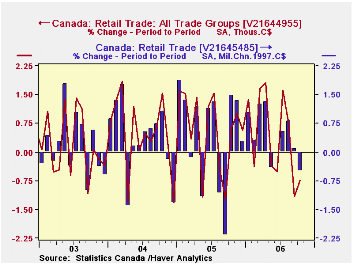
Further, press reports today also highlighted a fall in retail sales. These were off 0.5% in October in real terms. In current C$, the total was off 0.7%, but some of this is due to a 2.5% decrease at gas stations, likely due to prices. Other store groups, again in current dollars, saw declines, but some of this is monthly volatility in sectors that had been strong in September, especially clothing and shoes. But there were also decreases in furniture, building materials, general merchandise and sporting goods. So consumer demand, which has heretofore held up well, is now showing some hesitation.
In any event, we seem last month to have been right, unfortunately, to be concerned about Canada's growth prospects and will continue to monitor this developing situation.
| Canada: SA, Bil.Chn.97C$ | Oct 2006 | Sept 2006 | Aug 2006 | Oct 2005 | 2005 | 2004 | 2003 |
|---|---|---|---|---|---|---|---|
| Total GDP | 1089.7 | 1089.8 | 1094.5 | 1072.0 | 1063.0 | 1034.0 | 1002.9 |
| % Change | -0.0 | -0.4 | 0.3 | 1.6 | 2.8 | 3.1 | 2.0 |
| Goods-Producing Industries | -0.0 | -1.3 | 0.1 | -1.4 | 2.0 | 2.9 | 1.4 |
| Service-Producing Industries | -0.0 | -0.0 | 0.4 | 3.1 | 3.2 | 3.2 | 2.3 |
| Retail Trade* | 356.5 | 358.3 | 358.0 | 335.9 | 336.4 | 321.9 | 309.7 |
| % Change | -0.5 | 0.1 | 0.8 | 6.1 | 4.5 | 3.9 | 2.6 |

Tom Moeller
AuthorMore in Author Profile »Prior to joining Haver Analytics in 2000, Mr. Moeller worked as the Economist at Chancellor Capital Management from 1985 to 1999. There, he developed comprehensive economic forecasts and interpreted economic data for equity and fixed income portfolio managers. Also at Chancellor, Mr. Moeller worked as an equity analyst and was responsible for researching and rating companies in the economically sensitive automobile and housing industries for investment in Chancellor’s equity portfolio. Prior to joining Chancellor, Mr. Moeller was an Economist at Citibank from 1979 to 1984. He also analyzed pricing behavior in the metals industry for the Council on Wage and Price Stability in Washington, D.C. In 1999, Mr. Moeller received the award for most accurate forecast from the Forecasters' Club of New York. From 1990 to 1992 he was President of the New York Association for Business Economists. Mr. Moeller earned an M.B.A. in Finance from Fordham University, where he graduated in 1987. He holds a Bachelor of Arts in Economics from George Washington University.
More Economy in Brief


