 Global| May 03 2007
Upward Surprise on U.S. Productivity
Summary
Productivity mustered a larger gain than we had expected in Q1 but the trends still show productivity is on a deteriorating trend. Just as a refresher, recall that productivity is important because it governs the pace at which the [...]
 Productivity mustered a larger gain than we had expected in Q1 but the trends still show productivity is on a deteriorating trend.
Just as a refresher, recall that productivity is important because it governs the pace at which the economy can grow and it is an endogenous variable (one determined by the economic system not imposed upon it). Coupled with labor force growth, productivity sets the growth pace for the economy. Population growth is given to an economy. Labor force growth is the result of demographics (including population growth) tempered by economic decisions such as labor-leisure tradeoffs. Labor force growth can be augmented in small amounts by immigration. But the big variable that an economy controls that can alter its growth trends is productivity. All G-7 countries - indeed OECD countries and many developing nations - are seeing the same withering trend to population growth and advancing aging of the population. Slower population growth undercuts the base for growth in the labor force and therefore in the economy. Aging generally erodes labor force participation rates. So the key to keeping growth up is productivity.
A fading pace of productivity growth is bad news for a nation like the US with huge needs to pay for its national medical insurance program, a burdened Social Security system, an ample stock of debt already on the books plus running large current fiscal deficits. Aging will place more burdens on younger workers. Low productivity growth will only make hard choices even harder.
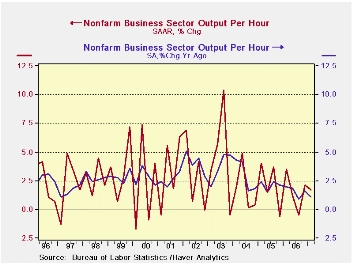
The trend to productivity growth is shown in the chart above using annualized quarterly changes as the red line and with the blue line guiding your eye to the predominant year/year trend. Despite quarterly volatility, the trend is clearly moving lower.
This a tough policy issue for the Fed and one it did not face under Greenspan since inflation fell and productivity rose keeping growth strong in a rare double win for policymakers that made Greenspan look as if he could walk on water. And indeed he can, but only when it is frozen. The problem for Bernanke is that the lake is warming up and he’s still in the middle. The Dilemma of Fed Policy
With the Fed having abandoned the V-G (Volcker-Greenspan) mantra that there is no inflation-growth conflict in the Fed’s mandate since low inflation boosts growth in the long run, the Fed is being forced into a bitter political dilemma. Should it to push for more growth as productivity fades or need it alter its inflation guideline? Congressman Frank continues to press the Fed to push for growth and to let wages rise. In dropping the old V-G approach to policy the Fed has fallen right into Frank’s trap.
This quarter’s numbers give the Fed some unexpected respite. While the GDP growth number is not good, productivity did revive more than expected. More helpful was the low 0.6% (annualized) rise in unit labor costs, that had been expected to be much higher. Now the trend in wage costs is much more up in the air, instead of clearly accelerating as it was previously. At 3.4% y/y (last quarter), unit labor costs were real threat to an inflation ceiling of 2%. At 1.3% (this quarter) the Fed again seems to have some breathing room. But make no mistake about it. This was a break for the quarter. Unless something changes, productivity is on a path to cause the Fed trouble. And evidence suggests that labor cost are still simmering. This quarter’s 2.3% rise in compensation costs comes after Q4’s rise of 8.5% making it hard to judge the trend. The Fed’s own recent Beige Book assessment of regional trends saw rather widespread pressure in the labor market despite this quarter’s beneficial reading in the productivity report. Quarterly numbers are volatile but the trends are telling.
| Year/Year Pct | 07/Q1 | 06/Q4 | 06/Q3 | 06/Q2 | 06/Q1 | 05/Q4 |
| Nonfarm Unit Labor Cost | 1.3% | 3.4% | 2.6% | 3.1% | 3.6% | 1.5% |
| Nonfarm Output/Hour | 1.1% | 1.6% | 0.9% | 1.9% | 2.0% | 2.1% |
| Nonfarm Comp/Hour | 2.4% | 5.0% | 3.5% | 5.1% | 5.7% | 3.7% |
| Nonfarm Real Comp/Hour | 0.0% | 2.9% | 0.1% | 1.0% | 1.9% | 0.0% |
| Manufacturing | ||||||
| MFG Unit Labor Cost | -2.0% | -0.5% | -2.3% | 0.1% | 2.0% | -1.2% |
| MFG Output/Hour | 3.6% | 3.9% | 4.2% | 3.6% | 4.1% | 4.6% |
| MFG Comp/Hour | 1.5% | 3.4% | 1.8% | 3.7% | 6.1% | 3.4% |
| MFG Real Comp/Hour | -0.9% | 1.4% | -1.5% | -0.3% | 2.3% | -0.4% |
by Robert Brusca May 3, 2007
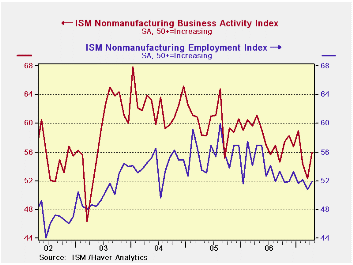 The Nonmanufacturing ISM rose smartly to 56 from 52.4. Its employment gauge rose to 51.9 from 50.8. Prices continue to be under upward pressures.
The details of the ISM report shows that the main measures of the survey are just below their period averages. The nonmanufacturing sector is dominated by services but also contains construction and mining. Apparently construction did pick up in the month. But despite the jump in activity, overall orders and backlogs were more restrained. Both showed growth or neutrality but each was below its customary reading (see relative calculations relative to the mean in the far right of the table). The readings that score lowest as a percentage of their range of values (percentiles) are supplier deliveries, inventory sentiment and import orders. Low supplier deliveries tell us there is still plenty of slack. The inventory reading tells us that inventories are more under control than they usually are and that could be a good sign for future ordering especially since growth in this sector has been strong. A weaker import reading could be a bad sign about activity or a sign that the weaker dollar has taken some toll on imports
During the period nonmanufacturing jobs averaged gains of 134K per month. The current ISM jobs barometer is just above the average for this period. Jobs: the outlook
Of course the ‘wild card’ in the nonmanufacturing jobs forecast is what happens with construction jobs. Construction spending in the month rose. And the ISM survey sees some increased construction activity. But those still might not be the right barometer for jobs. For consumer services, spending slowed in March, but again that may not be the right barometer for April, plus consumer service spending is strong apart from the unusual weak March result, having had a very brisk Q1 2007.
The service portion of the nonmanufacturing report has probably remained pretty firm. Construction is still a big question mark for any forecast. AND recent construction job growth has been volatile month to month. Still jobless claims have remained low and dipped further after the sample period for nonfarm employment passed. Claims do not act like a rash of construction job cuts have hit the street - or any others for that matter. That claims figure suggests that the job market is still probably pretty strong.
Overall the ISM nonmanufacturing index has been slowing despite the rebound this month. Still the ADP forecast seems far too weak at 64K overall. The ISM manufacturing survey showed a strong rise in the month for its jobs index. That should auger well for manufacturing job gains. April tends to be a strong month for job gains overall. The ISM nonmanufacturing reading was firm. We think a number like +120K or higher is sensible for private nonfarm jobs and government could boost things even beyond that. This month we part ways with the ADP Survey.
| ISM Nonmanufacturing Statistics from Jan. 1998 to Date | ||||||||||
|---|---|---|---|---|---|---|---|---|---|---|
| ISM-NMFG | Current | Last Mo | Std Dev | Average | SD%Avg | MAX | MIN | Range | Percentile | % of AVG |
| PM Activity | 56.0 | 52.4 | 4.7 | 57.5 | 8.2 | 67.9 | 40.5 | 27.4 | 56.6 | 97 |
| New Orders | 55.5 | 53.8 | 4.7 | 57.2 | 8.2 | 66.9 | 41.3 | 25.6 | 55.5 | 97 |
| Backlogs | 50.0 | 52.5 | 3.7 | 51.0 | 7.2 | 57.0 | 40.5 | 16.5 | 57.6 | 98 |
| Supplier Deliveries | 51.0 | 50.0 | 2.1 | 53.6 | 4.0 | 60.5 | 48.0 | 12.5 | 24.0 | 95 |
| Inventory Sentiment* | 60.5 | 63.0 | 2.7 | 63.0 | 4.3 | 69.0 | 55.0 | 14.0 | 39.3 | 96 |
| Inventories | 52.0 | 52.0 | 3.2 | 50.5 | 6.3 | 59.0 | 43.5 | 15.5 | 54.8 | 103 |
| Prices | 63.5 | 63.3 | 8.2 | 59.9 | 13.7 | 80.5 | 41.3 | 39.2 | 56.6 | 106 |
| Employment | 51.9 | 50.8 | 3.7 | 51.7 | 7.1 | 59.9 | 43.9 | 16.0 | 50.0 | 100 |
| Export Orders | 55.5 | 48.5 | 4.5 | 54.8 | 8.3 | 64.0 | 44.5 | 19.5 | 56.4 | 101 |
| Import Orders | 52.5 | 50.0 | 4.1 | 54.7 | 7.4 | 63.5 | 45.5 | 18.0 | 38.9 | 96 |
by Carol Stone May 3, 2007
A recently popular book on writing and grammar is titled "Eats, Shoots and Leaves". The title is ambiguous because the intent of the original writer of the phrase was to describes the diet of a particular animal: it "eats shoots and leaves". But the addition of the comma alters the meaning dramatically.
A somewhat parallel situation derives from our title above, "Driving Productivity Increases". Punctuation has no role here, but the meaning is just as ambiguous. On a day when productivity data are reported for Q1, a reader of this website might well expect this discussion to concern factors that generated the rise in Q1 productivity. But Mr. Brusca has done that elsewhere here. Our subject is, instead, driving. Today, the Federal Highway Administration reported miles driven in March for the total US and the 50 states. After a simple description of these mileage figures, we will discuss "driving productivity", that is, the amount of output (GDP) per mile driven. It, like labor productivity, is rising. 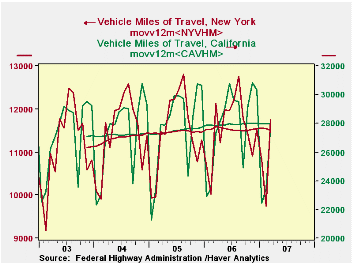
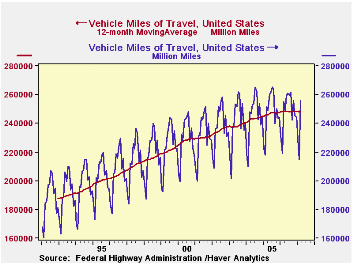
As seen in the first graph, total miles driven have flattened out. The 255.8 billion miles in March 2007 are a mere 0.3% above March 2006, and the 12-month moving average has declined outright by 0.2%. So people in the nation as a whole have restrained their driving.
The pattern around the nation varies widely, however. We looked at the top four states for miles driven, California, Texas, Florida and New York. The individual state data only began in 2003, so there's no much history to go on. Miles driven continue to increase in California, but more slowly than at this time last year. The March 2007 figure is 1.4% above the year-earlier and averaged across 12 months to smooth the seasonality, it is up 0.6%. The 12 months through March 2006, in turn, had been up 1.8% on the year before. In New York, a similar pattern of slowing growth had been in place. But February and March each had a marked decline from year-ago amounts, 2.8% and 3.0%. And the 12-month moving average now shows a non-trivial decline as well, 0.7%, for the period ending in March. People are driving less in New York State. 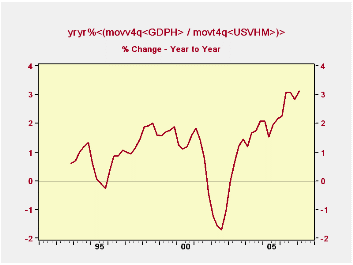
They are also driving less in Texas, somewhat unexpectedly. In Florida, miles driven are still increasing, but at a slower rate than before the run-up in gasoline prices. In both of these states, the March figure is a new monthly record, though. For the brief history we have, March seems to be a peak driving month during the year, although Texas has seen larger figures in the summer months of some years.
So what about "driving productivity". We compared GDP to mileage driven, calculating GDP per mile. As energy gets more expensive and people may be driving less, would that necessarily translate into weaker GDP. Is the US such a vehicle-dependent economy that it would suffer visibly by having to drive less? Encouragingly, over the last couple of years, this has not been the case. While some slowing may well result from this circumstance, it appears that more economical use of vehicles can offset at least some of the reduced driving volume. "Driving productivity increases" seems to be a statement of fact, not a misuse of words.
Total miles driven are contained in Haver's main USECON database. The state data are in REGIONAL. The graphs illustrate the new multiple series features of the upcoming version of DLXVG3 along with the manipulation of "Styles & Colors" to alter the colors of series from the "default" arrangement.
| Miles Traveled (Billions) | Mar 2007 | Feb 2007 | Jan 2007 | Year Ago | 2006 | 2005 | 2004 | 2000 |
|---|---|---|---|---|---|---|---|---|
| US | 255.8 | 215.0 | 229.1 | 255.0 | -- | -- | -- | -- |
| 12-mo Moving Average | 248.1 | 248.0 | 248.4 | 248.6 | 248.5 | 247.4 | 244.8 | 228.9 |
| California | 27.7 | 23.5 | 22.4 | 27.4 | 28.0 | 27.7 | 27.3 | -- |
| Texas | 21.3 | 17.9 | 18.4 | 21.0 | 19.6 | 19.5 | 19.0 | -- |
| Florida | 18.9 | 15.9 | 17.5 | 18.7 | 16.7 | 16.6 | 15.8 | -- |
| New York | 11.8 | 9.7 | 10.8 | 12.1 | 11.5 | 11.5 | 11.4 | -- |
| Memo: GDP/Mile | -- | 3.85(Q1) | -- | 3.74(Q1) | 3.83 | 3.72 | 3.64 | 3.57 |

Robert Brusca
AuthorMore in Author Profile »Robert A. Brusca is Chief Economist of Fact and Opinion Economics, a consulting firm he founded in Manhattan. He has been an economist on Wall Street for over 25 years. He has visited central banking and large institutional clients in over 30 countries in his career as an economist. Mr. Brusca was a Divisional Research Chief at the Federal Reserve Bank of NY (Chief of the International Financial markets Division), a Fed Watcher at Irving Trust and Chief Economist at Nikko Securities International. He is widely quoted and appears in various media. Mr. Brusca holds an MA and Ph.D. in economics from Michigan State University and a BA in Economics from the University of Michigan. His research pursues his strong interests in non aligned policy economics as well as international economics. FAO Economics’ research targets investors to assist them in making better investment decisions in stocks, bonds and in a variety of international assets. The company does not manage money and has no conflicts in giving economic advice.
More Economy in Brief


