 Global| Sep 22 2005
Unemployment Insurance Claims Again High Due to Hurricane
by:Tom Moeller
|in:Economy in Brief
Summary
Initial claims for unemployment insurance rose another 8,000 w/w to 432,000 last week following an upwardly revised 97,000 surge the prior week. Consensus expectations had been for 450,000 claims. The Labor Department indicated that [...]
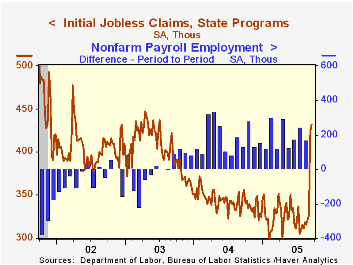
Initial claims for unemployment insurance rose another 8,000 w/w to 432,000 last week following an upwardly revised 97,000 surge the prior week. Consensus expectations had been for 450,000 claims.
The Labor Department indicated that 103,000 jobless claims last week and 91,000 the week prior were related to Hurricane Katrina which struck the Gulf Coast on August 29th. Last week, a 49,665 rise in claims in Louisiana was mostly Hurricane related and a 5,177 rise in Mississippi was all Hurricane related. Unadjusted, initial claims fell slightly w/w in California, New Jersey and in Pennsylvania.
The four-week moving average of initial claims rose to 376,250 (10.4% y/y) from 347,250 during the prior four weeks.
The latest claims figure covers the survey period for September nonfarm payrolls and claims were up 113,000 (35.4%) from the August period.
Continuing claims for unemployment insurance jumped 88,000 during the latest week following a lessened 8,000 rise the week prior.
The insured rate of unemployment rose to 2.1% following nine weeks at 2.0%.
Unemployment and Vacancy Fluctuations in the Matching Model: Inspecting the Mechanism from the Federal Reserve Bank of Richmond is available here.
| Unemployment Insurance (000s) | 09/17/05 | 09/10/05 | Y/Y | 2004 | 2003 | 2002 |
|---|---|---|---|---|---|---|
| Initial Claims | 432 | 424 | 23.4% | 343 | 402 | 404 |
| Continuing Claims | -- | 2,666 | -7.1% | 2,926 | 3,531 | 3,570 |
by Tom Moeller September 22, 2005
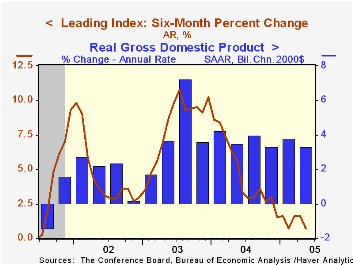
The August Composite Index of Leading Economic Indicators reported by the Conference Board fell 0.2% following a revised 0.1% dip in July. These declines and slight downward revisions to prior months' data lowered six-month growth in the leaders to 0.7%, the worst since 2001.
The breadth of one month gain amongst the 10 components of the leading index fell to 50%, down from a high of 85% during June. Lower consumer expectations had the largest negative effect on the leader's one month change.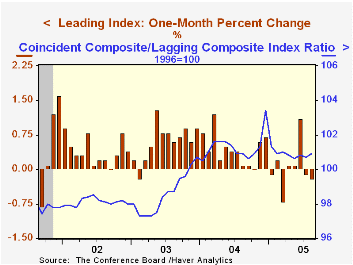
The method of calculating the contribution to the index from the interest rate yield spread has been revised. A negative contribution will now occur only when the spread inverts rather than when declining as in the past. More details can be found here.
The leading index is based on eight previously reported economic data series. Two series, orders for consumer goods and orders for capital goods, are estimated.
The coincident indicators rose 0.2% (2.7% y/y) with each of the four components up during the last six months.
The lagging indicators fell 0.1%, the first m/m decline this year. Increases since the 2004 low have been moderate by postwar standards. The ratio of coincident to lagging indicators, a measure of actual economic performance versus excess, rose slightly m/m but has moved sideways this year.
Visit the Conference Board's site for coverage of leading indicator series from around the world.
| Business Cycle Indicators | Aug | July | 6-Month Chg | 2004 | 2003 | 2002 |
|---|---|---|---|---|---|---|
| Leading | -0.2% | -0.1% | 0.7% | 7.7% | 5.1% | 5.0% |
| Coincident | 0.2% | 0.1% | 2.4% | 2.7% | 0.4% | -0.6% |
| Lagging | -0.1% | 0.3% | 2.4% | -0.1% | -0.1% | -0.7% |
by Carol Stone September 22, 2005
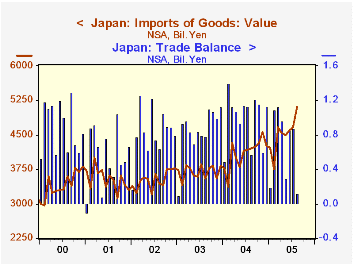
Japan's trade surplus shrank markedly in August from a year ago, reaching ¥116.3 billion from ¥572.9 billion. Exports grew vigorously, up 9.1%, but imports leaped 21.1%. As might be expected, petroleum accounted for a significant proportion of the import growth. Crude oil, refined product and other related gas products totaled ¥1,240.0 billion compared with ¥899.7 billion in August 2004. Press reports highlight this item, which is certainly large and likely to get larger. However, non-petroleum imports were also up considerably, by more than 16% over a year ago. This growth was spread across a number of goods categories.
Frequently, in interpretations of a nation's economic performance, imports are viewed negatively. The country is incurring additional foreign debt, or in Japan's case, reducing its domestic surplus in buying from abroad. Of course this is so, but that development has another, more favorable aspect: increasing imports can be a signal of rising demand. In fact, data on Japan's GDP through Q2 show gains in real terms for household spending, government consumption and private investment in plant and equipment. So demand has been expanding for the general kinds of merchandise being imported. The growth in August seems a strong hint that this continued into Q3.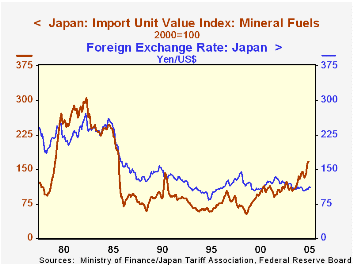
At the same time, we don't want to set aside concerns for Japan from surging energy costs. Nearly all of Japan's energy products are imported, so there is a potential for stress on the Japanese economy as oil and gas prices stay high. In that regard, it is interesting that despite the high dollar price of oil, the unit value of petroleum imports for Japan is less than in the prior energy "crisis" in the early 1980s, as seen in the second graph (although later data will no doubt show the unit value higher than the level in the graph, which is only through June). The difference of course is the exchange rate; the much stronger yen is holding back the yen cost of the petroleum. It's a small favor in the otherwise tenuous Japanese economic environment, but it can moderate the impact of the burdensome energy expenses.
| Japan Trade Not seasonally adjusted Bil. ¥ | Aug 2005 | Jul 2005 | Aug 2004 | Monthly Averages|||
|---|---|---|---|---|---|---|
| 2004 | 2003 | 2002 | ||||
| Exports | 5219.2 | 5536.9 | 4785.5 | 5097.5 | 4545.7 | 4342.4 |
| Imports | 5103.0 | 4666.6 | 4212.5 | 4101.4 | 3696.8 | 3518.9 |
| Balance | 116.3 | 870.3 | 572.9 | 996.1 | 848.9 | 823.5 |
| Petroleum Imports* | 1240.0 | 1059.3 | 899.7 | 798.1 | 717.2 | 615.7 |
| China: Balance | -287.1 | -183.1 | -206.7 | -183.7 | -174.6 | -229.0 |
| US: Balance | 486.7 | 649.5 | 474.4 | 580.6 | 548.9 | 636.3 |

Tom Moeller
AuthorMore in Author Profile »Prior to joining Haver Analytics in 2000, Mr. Moeller worked as the Economist at Chancellor Capital Management from 1985 to 1999. There, he developed comprehensive economic forecasts and interpreted economic data for equity and fixed income portfolio managers. Also at Chancellor, Mr. Moeller worked as an equity analyst and was responsible for researching and rating companies in the economically sensitive automobile and housing industries for investment in Chancellor’s equity portfolio. Prior to joining Chancellor, Mr. Moeller was an Economist at Citibank from 1979 to 1984. He also analyzed pricing behavior in the metals industry for the Council on Wage and Price Stability in Washington, D.C. In 1999, Mr. Moeller received the award for most accurate forecast from the Forecasters' Club of New York. From 1990 to 1992 he was President of the New York Association for Business Economists. Mr. Moeller earned an M.B.A. in Finance from Fordham University, where he graduated in 1987. He holds a Bachelor of Arts in Economics from George Washington University.
More Economy in Brief


