 Global| Apr 09 2008
UK Output: Suddenly on the Mend
Summary
The sequential growth rates for January tell the story compared to their February counterparts: In January year/eayr output growth was 0.7% sliding to an annual rate of 0.6% over six months and to a pace of 0.4% over three months. UK [...]
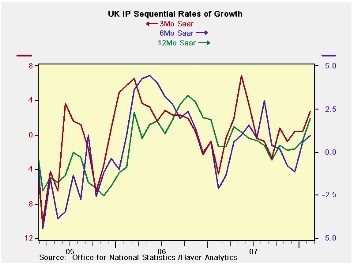
The sequential growth rates for January tell the story compared to their February counterparts: In January year/eayr output growth was 0.7% sliding to an annual rate of 0.6% over six months and to a pace of 0.4% over three months. UK MFG was slow and slowing. Now in February year-over-year growth is 2%, six-month growth still slows, but to 1%, and three-month growth is a solid rebound at 2.7%. Consumer durables are a big reason for the shift with a three-month growth rate up to 19.7% saar. Intermediate goods output is still declining over three months but capital goods output is up a strong 4.8% after being flat over three months in January. The detail shows that much of that rebound is in the volatile auto sector.
Still there is a clear sign of progress. The chart on the left demonstrates that a falling growth pattern has been arrested and features a fledgling upturn of some strength. It may be that the weakness in the pound sterling has something to do with this re-vitalization. Domestic UK spending patterns have not been so strong and confidence continues to slip. If the recovery in output is for real, and not just an artifact of monthly volatility, it is probably the exchange rate at work.
| UK IP and MFG | ||||||||||
|---|---|---|---|---|---|---|---|---|---|---|
| Saar except m/m | Mo/Mo | Feb 08 |
Jan 08 |
Feb 08 |
Jan 08 |
Feb 08 |
Jan 08 |
|||
| UK MFG | Feb 08 |
Jan 08 |
Dec 07 |
3Mo | 3-Mo | 6mo | 6mo | 12mo | 12mo | Q1 Date |
| MFG | 0.4% | 0.5% | -0.2% | 2.7% | 0.4% | 1.0% | 0.6% | 2.0% | 0.7% | 2.3% |
| Consumer | ||||||||||
| Durables | 2.3% | -0.3% | 2.5% | 19.7% | 3.1% | -1.8% | -5.0% | 2.3% | -1.1% | 10.3% |
| Nondurables | 0.3% | 0.3% | -0.5% | 0.4% | -1.2% | -0.2% | -0.4% | 0.5% | -1.3% | 0.4% |
| Intermediate | -0.1% | -0.4% | -0.1% | -2.5% | -3.7% | -0.8% | -1.1% | 0.4% | 0.6% | -3.3% |
| Capital | 0.5% | 0.1% | 0.5% | 4.8% | 0.0% | 3.5% | 2.4% | 3.6% | 2.2% | 2.5% |
| Memo: Detail | 1Mo% | 1Mo% | 1Mo% | 3Mo | 3Mo | 6mo | 6mo | 12mo | 12mo | Q-4 Date |
| Food Drink & Tobacco | 0.6% | 0.4% | -0.5% | 2.0% | 0.4% | 0.8% | -0.8% | 0.1% | -1.8% | 2.1% |
| Textile & Leather | 1.3% | -0.2% | 0.3% | 5.7% | -7.1% | -6.3% | -6.2% | 2.6% | 0.3% | -0.1% |
| Motor Vehicles & Trailer | 2.4% | 1.7% | 1.7% | 19.9% | -3.0% | 2.3% | 2.3% | 2.3% | 5.6% | 5.6% |
| Mining and Quarrying | -1.2% | -4.4% | 1.3% | -16.1% | -20.7% | -10.8% | -11.2% | -6.4% | -3.6% | -21.7% |
| Electricity, Gas & Water | 0.7% | -1.7% | 0.8% | -0.8% | -5.0% | 6.3% | 3.1% | 2.8% | 0.9% | -4.4% |
Robert Brusca
AuthorMore in Author Profile »Robert A. Brusca is Chief Economist of Fact and Opinion Economics, a consulting firm he founded in Manhattan. He has been an economist on Wall Street for over 25 years. He has visited central banking and large institutional clients in over 30 countries in his career as an economist. Mr. Brusca was a Divisional Research Chief at the Federal Reserve Bank of NY (Chief of the International Financial markets Division), a Fed Watcher at Irving Trust and Chief Economist at Nikko Securities International. He is widely quoted and appears in various media. Mr. Brusca holds an MA and Ph.D. in economics from Michigan State University and a BA in Economics from the University of Michigan. His research pursues his strong interests in non aligned policy economics as well as international economics. FAO Economics’ research targets investors to assist them in making better investment decisions in stocks, bonds and in a variety of international assets. The company does not manage money and has no conflicts in giving economic advice.


