 Global| Nov 26 2003
UK Growth in Q3 Strongest in 2-1/2 Years
Summary
As in the US, GDP in the UK was revised higher for Q3. From 0.6% reported a month ago, it was raised to 0.75%, the largest quarterly growth rate since the first quarter of 2001. The year-on-year growth rose to 2.0% from 1.9% reported [...]
As in the US, GDP in the UK was revised higher for Q3. From 0.6% reported a month ago, it was raised to 0.75%, the largest quarterly growth rate since the first quarter of 2001. The year-on-year growth rose to 2.0% from 1.9% reported initially. This is marginally faster than in Q2, making the best four-quarter performance since the middle of 2001.
Construction activity, up 2.5% on the quarter, and production of business services, up 1.0%, were both larger than originally estimated. Weakness remains, however, in manufacturing, mining, and transportation.
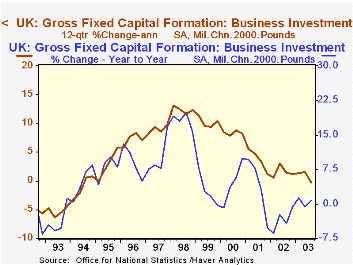
By type of expenditure, consumers and non-profit institutions continue to lead the UK expansion. Business investment has been erratic, falling in this latest period by 1.6%, which reversed a 2.0% advance in Q2. After the pre-Y2K buildup, a 12-quarter growth trend in private capital spending has been ratcheting lower, just piercing zero to -0.3% in Q3 (see chart nearby). More optimistically, recent movement in business investment has been less negative and these expenditures might firm up in coming months if domestic demand continues to grow and as the UK's trading partners also see renewed expansion that could lift foreign demand for its products.
Notably, unlike other countries, exports have not been a leader in recent UK growth. They were basically unchanged in Q3 and four-quarter "growth" is down at -4.3%. Imports have been relatively flat in recent periods, but the softness in exports has produced a net export deficit (in volume terms) averaging £11.3 billion over the last four quarters, a record by far. One assumes, however, that continuing prosperity among the UK's neighbors would help narrow that trade imbalance.
| Percent Changes | Qtr/QtrYear/ Year | 4th Qtr/4th Qtr||||||
|---|---|---|---|---|---|---|---|
| 3rd Qtr 2003 | 2nd Qtr 2003 | 1st Qtr 2003 | 2002 | 2001 | 2000 | ||
| GDP, Volume, Chained 2000 Prices | 0.7 | 0.6 | 0.2 | 2.0 | 2.0 | 1.9 | 2.9 |
| Manufacturing | 0.0 | 0.5 | -0.1 | -0.4 | -1.9 | -4.3 | 2.2 |
| Construction | 2.4 | 4.4 | -1.8 | 6.9 | 7.9 | 6.3 | -0.4 |
| Business Services | 1.0 | -0.3 | 1.5 | 3.0 | 1.8 | 3.2 | 4.7 |
| Households | 0.7 | 0.7 | -0.2 | 2.5 | 3.2 | 4.7 | 2.8 |
| Gross Fixed Capital Formation | -1.3 | 1.2 | -0.7 | 0.0 | 4.8 | -1.8 | 5.9 |
| Business Investment | -1.6 | 2.0 | -0.2 | 0.7 | -0.6 | -5.1 | 9.8 |
| Exports | 0.1 | -2.6 | 2.9 | -4.3 | -1.9 | -2.9 | 9.0 |
| Imports | 1.0 | -2.5 | 1.7 | -0.9 | 3.6 | 0.6 | 8.7 |
Carol Stone, CBE
AuthorMore in Author Profile »Carol Stone, CBE came to Haver Analytics in 2003 following more than 35 years as a financial market economist at major Wall Street financial institutions, most especially Merrill Lynch and Nomura Securities. She had broad experience in analysis and forecasting of flow-of-funds accounts, the federal budget and Federal Reserve operations. At Nomura Securities, among other duties, she developed various indicator forecasting tools and edited a daily global publication produced in London and New York for readers in Tokyo. At Haver Analytics, Carol was a member of the Research Department, aiding database managers with research and documentation efforts, as well as posting commentary on select economic reports. In addition, she conducted Ways-of-the-World, a blog on economic issues for an Episcopal-Church-affiliated website, The Geranium Farm. During her career, Carol served as an officer of the Money Marketeers and the Downtown Economists Club. She had a PhD from NYU's Stern School of Business. She lived in Brooklyn, New York, and had a weekend home on Long Island.
More Economy in Brief


