 Global| Jul 14 2009
U.S. 'YTD Budget Deficit Broaches $1 Trillion
by:Tom Moeller
|in:Economy in Brief
Summary
The U.S. government ran a budget deficit of $94.3 billion last month pulling the deficit during the first nine months of this fiscal year to $1.1 trillion. That compares to a deficit of $286 billion during the first nine months of [...]
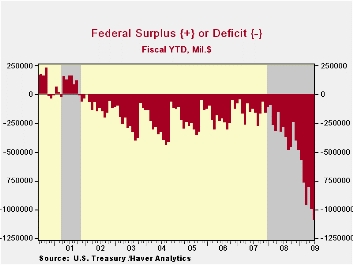 The U.S.
government ran a budget deficit of $94.3 billion last month pulling the
deficit during the first nine months of this fiscal year to $1.1
trillion. That compares to a deficit of $286 billion during the first
nine months of last year when the 2008 deficit totaled $454.8 billion.
Year-to-date the budget deficit is running at roughly 7.7% of GDP. The
Congressional Budget Office's recent deficit estimate of $1.7 trillion
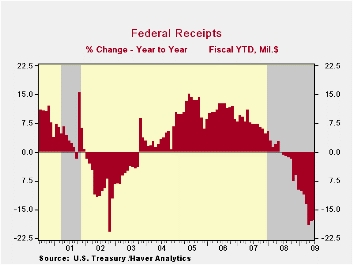
for FY09 amounts to 11.9% of GDP.· Net revenues during the first nine
months of FY09 were down 17.9% y/y. Individual income tax receipts fell
21.9% y/y through June reflecting higher unemployment. Corporate tax
receipts mirror the drying up of profitability and fell by more than
one-half. Employment taxes fell for the first time since 2003 and were
down by 0.2% and unemployment insurance tax receipts fell 6.2%. Estate
& gift taxes fell 17.4% after 13.6% growth last year.
The U.S.
government ran a budget deficit of $94.3 billion last month pulling the
deficit during the first nine months of this fiscal year to $1.1
trillion. That compares to a deficit of $286 billion during the first
nine months of last year when the 2008 deficit totaled $454.8 billion.
Year-to-date the budget deficit is running at roughly 7.7% of GDP. The
Congressional Budget Office's recent deficit estimate of $1.7 trillion
for FY09 amounts to 11.9% of GDP.· Net revenues during the first nine
months of FY09 were down 17.9% y/y. Individual income tax receipts fell
21.9% y/y through June reflecting higher unemployment. Corporate tax
receipts mirror the drying up of profitability and fell by more than
one-half. Employment taxes fell for the first time since 2003 and were
down by 0.2% and unemployment insurance tax receipts fell 6.2%. Estate
& gift taxes fell 17.4% after 13.6% growth last year.
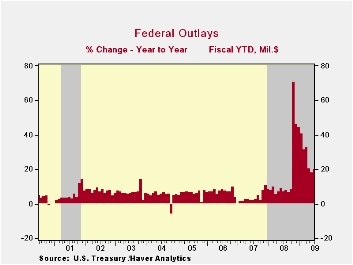
 Swelled
by TARP, U.S. government outlays surged by 20.5% from last fiscal
year's first nine months. Outlays under the Government's Troubled Asset
Relief Program (TARP) amounted to a much-reduced $11.3B last month but
for the first nine months of the program totaled $318.8B. The U.S.
Treasury has adopted the view that these TARP expenditures should be
counted like any other spending. When the banks repay the Treasury,
these funds will be counted as revenue. Accounted for in this way, TARP
causes a surge in the budget deficit when the funds are distributed to
the banks, but leads to a smaller deficit, or perhaps a surplus, when
repayments are received.
Swelled
by TARP, U.S. government outlays surged by 20.5% from last fiscal
year's first nine months. Outlays under the Government's Troubled Asset
Relief Program (TARP) amounted to a much-reduced $11.3B last month but
for the first nine months of the program totaled $318.8B. The U.S.
Treasury has adopted the view that these TARP expenditures should be
counted like any other spending. When the banks repay the Treasury,
these funds will be counted as revenue. Accounted for in this way, TARP
causes a surge in the budget deficit when the funds are distributed to
the banks, but leads to a smaller deficit, or perhaps a surplus, when
repayments are received.
 Defense spending (19% of total outlays) rose
16.2% fiscal year-to-date. Medicare expenditures (12% of outlays)
nearly doubled and "income security" spending (11% of outlays) jumped
20.6% after 7.5% growth last year. Social security payments rose an
elevated 9.1% but net interest payments continued to fall by nearly
one-third with lower interest rates.
Defense spending (19% of total outlays) rose
16.2% fiscal year-to-date. Medicare expenditures (12% of outlays)
nearly doubled and "income security" spending (11% of outlays) jumped
20.6% after 7.5% growth last year. Social security payments rose an
elevated 9.1% but net interest payments continued to fall by nearly
one-third with lower interest rates.
The Government's financial data are available in Haver's USECON database, with extensive detail available in the specialized GOVFIN.· The Economic Crisis and the Fiscal Crisis: 2009 and Beyond from Alan J. Auerbach, University of California, Berkeley, and William G. Gale, Brookings Institution, is available here.
| US Government Finance | June | May | Y/Y | FY 2008 | FY 2007 | FY 2006 |
|---|---|---|---|---|---|---|
| Budget Balance | -94.3B | $-189.7B | $33.5B (6/08) |
-$454.8B | -$161.5B | -$248.2B |
| Net Revenues | $215.4B | $17.2B | -17.1% | -1.7% | 6.7% | 11.8% |
| Net Outlays | $309.7B | $306.9B | 36.8% | 9.1% | 2.8% | 7.4% |

Tom Moeller
AuthorMore in Author Profile »Prior to joining Haver Analytics in 2000, Mr. Moeller worked as the Economist at Chancellor Capital Management from 1985 to 1999. There, he developed comprehensive economic forecasts and interpreted economic data for equity and fixed income portfolio managers. Also at Chancellor, Mr. Moeller worked as an equity analyst and was responsible for researching and rating companies in the economically sensitive automobile and housing industries for investment in Chancellor’s equity portfolio. Prior to joining Chancellor, Mr. Moeller was an Economist at Citibank from 1979 to 1984. He also analyzed pricing behavior in the metals industry for the Council on Wage and Price Stability in Washington, D.C. In 1999, Mr. Moeller received the award for most accurate forecast from the Forecasters' Club of New York. From 1990 to 1992 he was President of the New York Association for Business Economists. Mr. Moeller earned an M.B.A. in Finance from Fordham University, where he graduated in 1987. He holds a Bachelor of Arts in Economics from George Washington University.
More Economy in Brief


