 Global| May 07 2009
U.S. Worker Productivity Inches Up, But Underlying Cost Pressures Mount
by:Tom Moeller
|in:Economy in Brief
Summary
It was a recovery, but not much of one. Labor productivity in the nonfarm business sector rose an expected 0.8% (AR) last quarter and mostly recouped a revised 0.6% slip at the end of last year. The latest uptick, however, has done [...]
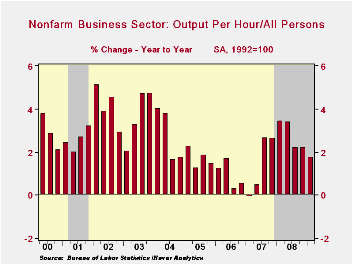
It was a recovery, but not much of one. Labor productivity in the nonfarm business sector rose an expected 0.8% (AR) last quarter and mostly recouped a revised 0.6% slip at the end of last year. The latest uptick, however, has done little to diminish the drastic weakening of labor productivity of late. The unchanged level over six months is the weakest performance since early-2007 which itself was the poorest in ten years.
Though productivity growth has slowed dramatically, it would
have been worse were businesses not quick in responding to the output
shortfall by cutting employment and hours-worked. Output fell at an
8.2% annual rate last quarter after falling 8.8% during 4Q '08. These
declines marked the quickest back-to-back since early 1958. However,
businesses responded quickly by cutting employment and hours worked at
a 9.0% rate last quarter and by 8.3% during 4Q. 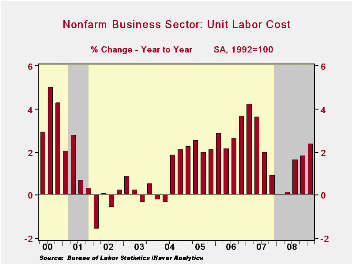
The drop in productivity growth has hurt corporations' bottom lines due in no small part to the fact that growth in compensation costs has remained fairly firm. It rose 4.1% last quarter and that lifted the y/y growth to 4.2%. Annually, growth in compensation has been roughly stable near the 4% level since 2001.
The combination of recently diminished productivity growth and stable gains in compensation has increased costs. Growth in unit labor costs remained a firm 3.3% during 1Q following the 5.7% jump during 4Q. The increases raised the six-month growth in costs to 4.5% from just 0.9% during all of last year.
In the factory sector the pressure on corporations' bottom lines has been more intense. Worker productivity fell 3.4% during 1Q (-3.3% y/y), down for the fourth consecutive quarter. Year-to-year, the drop in productivity came as output fell faster (-14.0%) than hours worked (-11.1%). Unit labor cost growth in the factory sector surged again. The 16.7% quarterly rate of increase during 1Q lifted the annual gain to 11.5% which compares to just a 3.2% gain during all of last year. That decline in productivity growth has outpaced firms' ability to cut compensation costs. In fact, there's been no cut at all. Compensation growth of 12.8% last quarter lifted the y/y gain to 7.9%, nearly double last year's 4.1% advance.
The productivity & cost figures are available in Haver's USECON database.
Accounting for cross-country differences in income per capita from the Federal Reserve Bank of Philadelphia can be found here.
| Nonfarm Business Sector (SAAR, %) | 1Q '09 | 4Q '08 | Y/Y | 2008 | 2007 | 2006 |
|---|---|---|---|---|---|---|
| Output per Hour | 0.8 | -0.6 | 1.8 | 2.8 | 1.4 | 0.9 |
| Compensation per Hour | 4.1 | 5.2 | 4.2 | 3.7 | 4.1 | 3.8 |
| Unit Labor Costs | 3.3 | 5.7 | 2.4 | 0.9 | 2.7 | 2.8 |
by Tom Moeller May 7, 2009
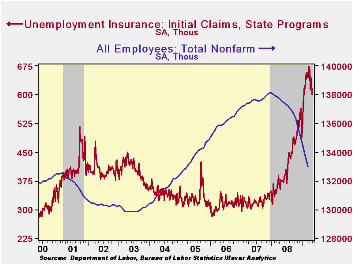
Another sign that the U.S. job market is firming was provided
by the decline in initial claims for unemployment insurance. They fell
34,000 last week to 601,000 which was their lowest level since
late-January. Claims have fallen 11.0% from the March high. Still,
despite the improvement, claims remain near the ten-year high. The
four-week average of claims fell to 623,500, the lowest level since
mid-February.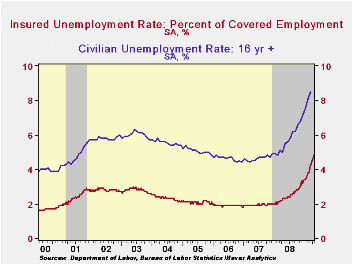
As was the case last week, if the pace of worker layoffs has slowed rehiring of unemployed workers has not picked up. Continuing claims for unemployment insurance increased to a record high of 6,351,000 and they remain twice the year ago level. The series dates back to 1966. The four-week average of continuing claims also rose to another record of 6,207,250. Continuing claims provide some indication of workers' ability to find employment and they lag the initial claims figures by one week.
The Labor Department indicated that the largest increases in initial claims for the week ending April 25 were in Michigan (+9,998), Massachusetts (+4,277), Kentucky (+3,681), North Carolina (+2,549), and New York (+2,219), while the largest decreases were in California (-10,833), Georgia (-4,174), South Carolina (-3,676), Wisconsin (-3,341), and New Jersey (-2,810).
Despite the improvement in the job market, the insured rate of unemployment which follows the continuing claims figures rose yet again to 4.8%. That level was double last April and the highest level since 1983. During the last ten years there has been a 93% correlation between the level of the insured unemployment rate and the overall rate of unemployment published by the Bureau of Labor Statistics.Clearly, the latest weekly figure understates labor market distress in some states. The highest insured unemployment rates in the week ending April 18 were in Oregon (7.6 percent), Michigan (7.2), Wisconsin (6.6), Pennsylvania (6.5), Idaho (6.4), Nevada (6.4), Rhode Island (6.1), New Jersey (5.8), Vermont (5.8), and Alaska (5.7).
The unemployment insurance claim data is available in Haver's WEEKLY database.
| Unemployment Insurance (000s) | 05/01/09 | 04/25/09 | 04/18/09 | Y/Y | 2008 | 2007 | 2006 |
|---|---|---|---|---|---|---|---|
| Initial Claims | 601 | 635 | 645 | 61.6% | 420 | 321 | 313 |
| Continuing Claims | -- | 6,351 | 6,295 | 110.9% | 3,342 | 2,552 | 2,459 |
by Robert Brusca May 7, 2009
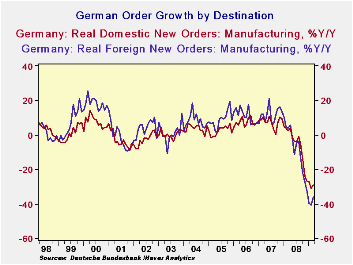
Foreign orders that had been falling a bit faster than those
from domestic sources were up by a sharp 5.6% m/m in May compared to a
rise of 1.1% for orders from domestic sources. German factory orders
from outside the 16-nation euro region rose 5.1 percent in March from
February indicating that much of the orders strength was not just
foreign but outside the zone as well. Export orders for investment
goods rose 9.1 percent, driven by demand from within and outside the
euro area.
Data trends however have swallowed up the good news. Three
month growth rates of orders and sales are still declining faster than
they did over six-months. Order growth is still accelerating in the
downward direction. In the quarter the drop in sales and in orders
remains horrific.
Even so the rise in orders is an encouraging sign. Even if the
sharp rise this month has been crushed by the trends of past weakness,
it is step in the right direction. This is how the trip toward
stability starts. Germany is getting its break in terms of improved
demand from external sources. Germany’s domestic initiatives- as well
as initiatives from the e-Zone itself- are not yet bearing much fruit.
At least the ECB took some further steps today in monetary policy to
cut rates and to shoulder added policy moves.
| German Orders and Sales By Sector and Origin | ||||||||
|---|---|---|---|---|---|---|---|---|
| Real and SA | % M/M | % Saar | ||||||
| Mar-09 | Feb-09 | Jan-09 | 3-MO | 6-Mo | 12-Mo | Yr Ago | QTR-2-Date | |
| Total Orders | 3.3% | -3.1% | -6.7% | -23.9% | -12.8% | -33.1% | 3.2% | -46.5% |
| Foreign | 5.6% | -0.9% | -10.9% | -24.5% | -13.1% | -36.0% | 3.9% | -53.7% |
| Domestic | 1.1% | -5.5% | -1.8% | -22.6% | -12.0% | -29.4% | 2.2% | -36.9% |
| Real Sector Sales | ||||||||
| MFG/Mining | 1.5% | -4.7% | -6.6% | -33.7% | -18.6% | -21.9% | 3.3% | -45.0% |
| Consumer | -0.4% | -3.3% | -6.0% | -33.0% | -18.2% | -11.7% | -0.9% | -25.7% |
| Cons Durables | -1.4% | -7.8% | -2.2% | -37.4% | -20.9% | -22.9% | 0.1% | -40.2% |
| Cons Non-Durable | -0.3% | -2.6% | -6.6% | -32.4% | -17.8% | -9.7% | -1.0% | -22.8% |
| Captial Gds | 4.8% | -5.2% | -9.4% | -34.5% | -19.1% | -24.8% | 6.0% | -53.9% |
| Intermediate Gds | -0.7% | -3.3% | -4.6% | -29.6% | -16.1% | -24.6% | 4.0% | -44.0% |
| All MFG-Sales | 1.5% | -4.8% | -6.6% | -33.5% | -18.5% | -22.1% | 3.3% | -45.3% |

Tom Moeller
AuthorMore in Author Profile »Prior to joining Haver Analytics in 2000, Mr. Moeller worked as the Economist at Chancellor Capital Management from 1985 to 1999. There, he developed comprehensive economic forecasts and interpreted economic data for equity and fixed income portfolio managers. Also at Chancellor, Mr. Moeller worked as an equity analyst and was responsible for researching and rating companies in the economically sensitive automobile and housing industries for investment in Chancellor’s equity portfolio. Prior to joining Chancellor, Mr. Moeller was an Economist at Citibank from 1979 to 1984. He also analyzed pricing behavior in the metals industry for the Council on Wage and Price Stability in Washington, D.C. In 1999, Mr. Moeller received the award for most accurate forecast from the Forecasters' Club of New York. From 1990 to 1992 he was President of the New York Association for Business Economists. Mr. Moeller earned an M.B.A. in Finance from Fordham University, where he graduated in 1987. He holds a Bachelor of Arts in Economics from George Washington University.
More Economy in Brief


