 Global| Jun 07 2007
U.S. Wholesale Inventories Signal Smoother Sailing
Summary
Wholesale inventory trends tell a very positive story. We take out the volatile and special readings from autos and petroleum to look at aggregated stocks and sales trends for all other wholesale classifications. Once done we obtain [...]
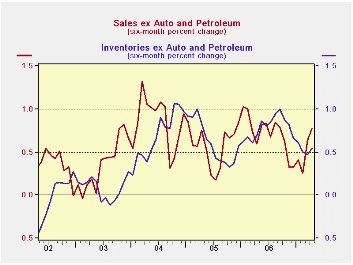
Wholesale inventory trends tell a very positive story. We take out the volatile and special readings from autos and petroleum to look at aggregated stocks and sales trends for all other wholesale classifications. Once done we obtain the chart plotted on the left that shows sales have speeded up as inventories have slowed. They have done that now for the second month in a row on six-month trends. Moreover, it shows that the ramping down in inventories has hit a low and apparent turning point in its decelerating rate of growth, yet another indication that the industry might be through its adjustment phase.
The table below on inventories and sales behavior provides industry detail and time horizon cohorts for that detail. Over three months all main categories, save two, show that sales growth has surpassed inventory growth. The trend of sales (S) outstripping inventories (I) is widespread. Indeed, the two categories that have sales growth above inventory growth are not deficient in their rate of growth by much. Six-month horizons also are very solid. The S>I growth trend seems pretty solid and well-established for now.
Additionally the I/S ratios are in good shape. The overall ratio for all of wholesaling is at a new low dating back to 1998. Durables excluding autos are in their bottom 18 percentile and for nondurables excluding petroleum the ratio is in its bottom 10 percentile.
Conclusion: Overall inventories are in good shape relative to sales. The recent growth rates of inventories relative to sales are settled into a good set of relationships as well. And best of all is the fact that sales growth is on an uptrend. The wholesale report is quite constructive and upbeat.
| I:S ratio | |||||||
|---|---|---|---|---|---|---|---|
| All growth rates annualized | Inventory-&-Sales Trends: Wholesalers | Percent of | |||||
| 2007.Apr | 3-mos | 6-mos | 12-mos | Range | |||
| Sales | Inventories | Sales | Inventories | Sales | Inventories | 1998-date | |
| All Wholesaling | 19.3% | 4.3% | 12.8% | 4.6% | 8.8% | 7.1% | 0.0% |
| Durables | 9.2% | -1.7% | 7.2% | 0.4% | 7.8% | 5.2% | 7.8% |
| Durables less autos | 9.2% | 2.2% | 7.0% | 3.0% | 7.6% | 7.8% | 19.1% |
| Autos | 9.4% | -21.0% | 8.0% | -13.1% | 8.7% | -7.6% | 0.9% |
| Computers | 3.6% | 5.1% | -0.3% | 0.8% | 5.4% | 10.6% | 38.3% |
| Machinery | 3.5% | -2.5% | 8.4% | 2.3% | 5.7% | 7.7% | 33.0% |
| Other Durables | 11.8% | 4.2% | 7.8% | 3.5% | 8.5% | 7.6% | 14.8% |
| Non-durables | 29.9% | 15.7% | 18.6% | 12.4% | 9.7% | 10.4% | 5.2% |
| Non-durables less Petrol | 17.0% | 12.2% | 12.3% | 12.9% | 9.8% | 11.0% | 9.6% |
| Petroleum | 94.5% | 58.5% | 46.4% | 8.2% | 9.3% | 4.7% | 45.2% |
| Groceries | 21.7% | 23.4% | 21.8% | 20.7% | 15.3% | 17.1% | 50.4% |
| Other Non-durables | 15.0% | 9.6% | 8.5% | 11.0% | 7.7% | 9.6% | 11.3% |
by Carol Stone June 7, 2007
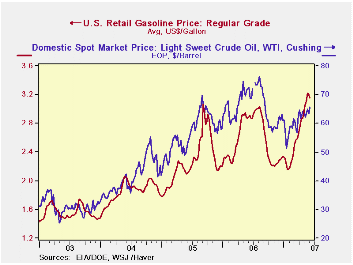
As prices are sustained at stratospheric levels, we're all learning the mechanics of gasoline production. Special conditions that matter little at $1.00/gallon become significantly more important at $3.00. It's also hard to know what represents ordinary supply-demand movement and what is a "special condition".
The Energy Information Administration of the Department of Energy (EIA) publishes its weekly petroleum situation every Wednesday, with gasoline prices measured through the Monday just before and other data taken as of the previous Friday. In this week's report, released yesterday morning, the national average retail price of "regular grade" gasoline fell -- that's "fell" -- in the week to June 4 by 5.2 cents to $3.157/gallon. The prior week, which included the Memorial Day weekend, saw a minuscule 0.9-cents decline. Small though this was, it is notable that the price did not rise further despite the holiday weekend driving.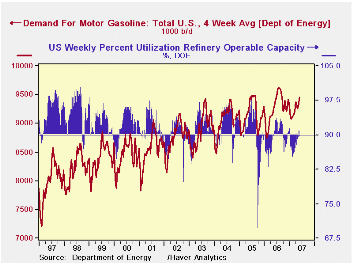
We last checked in with the energy markets three weeks ago, and we highlighted the light inventory situation for gasoline, unusual for the post-winter season, which has pushed gasoline prices to record highs. We attributed this to demand conditions that weren't nearly as weak this winter as has traditionally been the case. It's also evident from the second graph that even as demand for gasoline has grown, refiners have not been able to keep up. We show refining capacity utilization and we've drawn a line at 90%. Almost continuously since the middle of 1993, utilization has been well above this reference line. If we graph the variable with bars, they point up and down around the "horizontal reference". We see easily then that Hurricanes Katrina and Rita hurt refiners badly, and it's clear that refinery utilization rates have remained well below our reference point even as they have increased somewhat over the last few weeks. Thus, refining has not recovered from those big 2005 storms, leaving the industry -- and prices -- more vulnerable to ordinary operating outages.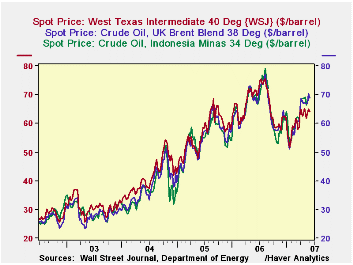
Another quirk in these data concerns the relationship between prices of various crudes, especially the US base, West Texas Intermediate (WTI) as delivered at Cushing, Oklahoma. As the EIA explain in This Week in Petroleum for May 2, conditions regarding the oil itself and also the operation of the Cushing Hub have depressed the price of WTI relative to other oils. In the third graph, WTI is seen to be lower over the last 3 months or so than Brent and Indonesian oil, which are both "heavier" and should have lower prices than WTI. 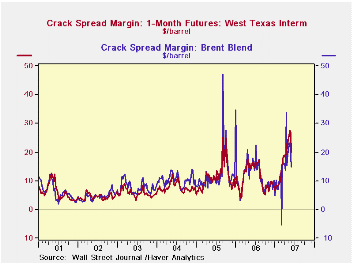 So when the price of gasoline has risen more than proportionately to the crude oil we're most familiar with, it may not be so much that refiners are trying to gouge their customers. In fact, the "crack spread" for Brent crude, while still high by past comparisons, has come down markedly from its recent levels. A similar measure for WTI fell last week, but it remains about $5 more per barrel than Brent, when the usual condition has been for the WTI crack spread to be marginally less than the Brent spread (since the crude is usually more expensive to begin with). As we noted at the beginning of this commentary, it makes one wonder if this mismatch of WTI and Brent (and other crude oils) is a "special condition" to be discounted as temporary, or is it a characteristic of the increasing supply/demand strains in the world energy market and in the US in particular? In that event, both energy suppliers and users would want factor the new relationships into their operating strategies.
The data here on prices and US inventories are in the OILWKLY database. Haver Analytics analysts perform seasonal adjustment on some demand and supply series; these are maintained in our WEEKLY database.
| Select Oil Market Indicators | June 4 | May 28 | May 21 | Month- Ago Week | Year-Ago Week | 2006 | 2005 |
|---|---|---|---|---|---|---|---|
| Gasoline, US Regular Grade (cents/gal) | 315.7 | 320.9 | 321.8 | 305.4 | 289.2 | 257.2 | 227.0 |
| Crude Oil: West Texas Intermediate ($/barrel) | June 1 | May 25 | May 18 | 63.79 | 71.50 | 66.13 | 56.50 |
| 63.94 | 64.94 | 63.61 | |||||
| UK Brent | 68.91 | 70.32 | 66.92 | 66.92 | 69.43 | 65.19 | 54.58 |
| Refinery Utilization (%) | 89.63 | 91.08 | 91.10 | 89.03 | 90.97 | 89.36 | 90.35 |
| Gasoline Stock: Days' Supply | 21.3 | 21.0 | 21.0 | 20.9 | 22.5 | 22.7 | 22.8 |

Robert Brusca
AuthorMore in Author Profile »Robert A. Brusca is Chief Economist of Fact and Opinion Economics, a consulting firm he founded in Manhattan. He has been an economist on Wall Street for over 25 years. He has visited central banking and large institutional clients in over 30 countries in his career as an economist. Mr. Brusca was a Divisional Research Chief at the Federal Reserve Bank of NY (Chief of the International Financial markets Division), a Fed Watcher at Irving Trust and Chief Economist at Nikko Securities International. He is widely quoted and appears in various media. Mr. Brusca holds an MA and Ph.D. in economics from Michigan State University and a BA in Economics from the University of Michigan. His research pursues his strong interests in non aligned policy economics as well as international economics. FAO Economics’ research targets investors to assist them in making better investment decisions in stocks, bonds and in a variety of international assets. The company does not manage money and has no conflicts in giving economic advice.
More Economy in Brief


