 Global| Oct 08 2009
U.S. Weekly Jobless InsuranceClaims Fall To Lowest Since January
by:Tom Moeller
|in:Economy in Brief
Summary
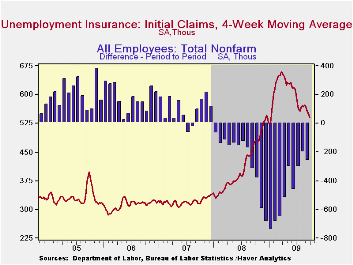
The labor market signaled improvement again. Initial claims for unemployment insurance fell last week to the lowest level since early-January. The Labor Department indicated that claims fell to 521,000 from an upwardly revised 554,000 [...]
 The labor
market signaled improvement again. Initial claims for unemployment
insurance fell last week to the lowest level since early-January. The
Labor Department indicated that claims fell to 521,000 from an upwardly
revised 554,000 during the prior week. Both figures are down sharply
from the peak reached in March of 674,000 claims. The latest decline
contrasted with Consensus expectations for a smaller decline to 540,000
claims.· The largest decreases in initial claims during the week ending
September 26 were in New York (-2,253, 14.1% y/y), North Carolina
(-1,609, 26.0% y/y), South Carolina (-1,159, -7.8% y/y), Arkansas
(-818, 39.6% y/y), and Florida (-734, 37.0% y/y). while the largest
increases were in California (+4,467, 36.7% y/y), Ohio (+3,421, 30.2%
y/y), Illinois (+1,815, 51.2% y/y), Missouri (+1,049, 43.0% y/y), and
Tennessee (+1,048, 68.3% y/y).
The labor
market signaled improvement again. Initial claims for unemployment
insurance fell last week to the lowest level since early-January. The
Labor Department indicated that claims fell to 521,000 from an upwardly
revised 554,000 during the prior week. Both figures are down sharply
from the peak reached in March of 674,000 claims. The latest decline
contrasted with Consensus expectations for a smaller decline to 540,000
claims.· The largest decreases in initial claims during the week ending
September 26 were in New York (-2,253, 14.1% y/y), North Carolina
(-1,609, 26.0% y/y), South Carolina (-1,159, -7.8% y/y), Arkansas
(-818, 39.6% y/y), and Florida (-734, 37.0% y/y). while the largest
increases were in California (+4,467, 36.7% y/y), Ohio (+3,421, 30.2%
y/y), Illinois (+1,815, 51.2% y/y), Missouri (+1,049, 43.0% y/y), and
Tennessee (+1,048, 68.3% y/y).
 Continuing
claims for unemployment
insurance during the latest week fell 72,000 to their lowest level
since late-March. The decline continues to owe partially to the
exhaustion of benefits. Continuing claims provide an indication of
workers' ability to find employment. The four-week average of
continuing claims fell modestly to 6,144,250. This series dates back to
1966.
Continuing
claims for unemployment
insurance during the latest week fell 72,000 to their lowest level
since late-March. The decline continues to owe partially to the
exhaustion of benefits. Continuing claims provide an indication of
workers' ability to find employment. The four-week average of
continuing claims fell modestly to 6,144,250. This series dates back to
1966.
Extended benefits for unemployment insurance rose sharply for the fourth consecutive week. Through mid-September extended benefits averaged 465,295. Congress is now debating who should qualify for another benefits extension. The House passed a bill last month lengthening benefits by 13 weeks for individuals in high-unemployment states.
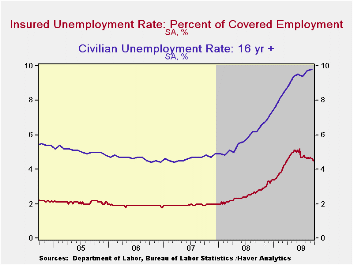
The insured rate of unemployment slipped to
4.5% and matched its lowest since early-April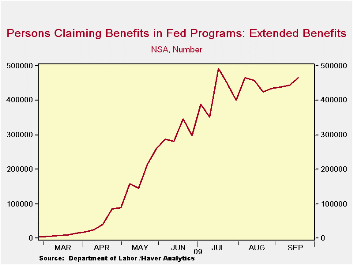 The rate reached a high
of 5.2% during late-June. During the last ten years, there has been a
93% correlation between the level of the insured unemployment rate and
the overall rate of unemployment published by the Bureau of Labor
Statistics.
The rate reached a high
of 5.2% during late-June. During the last ten years, there has been a
93% correlation between the level of the insured unemployment rate and
the overall rate of unemployment published by the Bureau of Labor
Statistics.
The highest insured unemployment rates in the week ending September 19 were in Puerto Rico (6.1 percent), Oregon (5.3), Nevada (5.2), Pennsylvania (5.0), California (4.9), Michigan (4.8), Wisconsin (4.7), Arkansas (4.6), North Carolina (4.6), and South Carolina (4.5). The lowest rates were in North Dakota (1.0%), South Dakota (1.1), Virginia (2.1), Wyoming (2.5), Maine (2.5), Texas (2.6), Colorado (3.0), Minnesota (3.1), Maryland (3.1), Mississippi (3.5), New York (3.5), Florida (3.9), and Georgia (3.9).· The unemployment insurance claims data is available in Haver's WEEKLY database and the state data is in the REGIONW database.
Was Monetary Policy Optimal During Past
Deflation Scares? from the Federal Reserve Bank of
Kansas City is available here.
| Unemployment Insurance (000s) | 10/02/09 | 09/26/09 | 09/19/09 | Y/Y | 2008 | 2007 | 2006 |
|---|---|---|---|---|---|---|---|
| Initial Claims | 521 | 554 | 534 | 9.0% | 420 | 321 | 313 |
| Continuing Claims | -- | 6,040 | 6,112 | 63.2% | 3,342 | 2,552 | 2,459 |
| Insured Unemployment Rate (%) | -- | 4.5 | 4.6 | 2.8 (09/2008) | 2.5 | 1.9 | 1.9 |
by Robert Brusca October 8, 2009
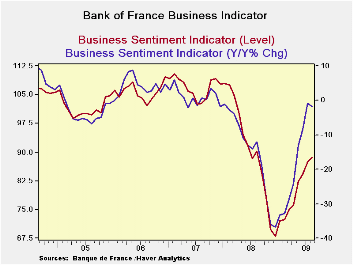
The Bank of France monthly business survey continues to show a
strong uptrend. The overall industry sentiment index (in red at the
bottom of the table) scored a reading of 92 up from 89 in August, a
standing of 30% in its range of values and above its average of 90
since October 1988. This is very good news, although the range standing
is till quite low. There is along way to go to get to ‘normal’.
The production index has been flirting with positive values in
three of the last five months so the move up to 0.59 from -0.77 is not
so special this month. That reading compares with a 12-month average of
minus 10 and a long term averages of +6. It stands in the 38th
percentile of its range.
The production outlook index is up for the second time in
three months rebounding from a reading of minus 1.36 in August to +1.23
in September. This reading, too, is better than its 12-month average of
minus 7 and below its long terms average of +6. It stands in the 30th
percentile of its range.
Demand is still quite negative and is assessed at a reading of
-32. That is above the 12-month value of -37 but below the long term
average of +1. Still it sits at a weak 16th percentile of its range.
Foreign demand (orders) is barely better standing in the in the 19th
percentile of its range.
New orders are faring better than the accumulated stock of
orders (demand). The new order index fell by 2.62 points after two
months of gains. Still the index stands in the 29th percentile of its
range.
Job losses stepped up in the current month but the survey is
on a definite improving trend. The jobs component for current hiring is
in the 59th percentile of its range. For future hiring the index is the
52 percentile of its range and that indicator improved in the month.
In short French industry is still assessed at poor levels. But
the improvement of the overall index is quite dramatic and the momentum
for continued improvement is still in place. Optimism about France is
not about being there but about getting there.
| Bank of France Monthly INDUSTRY Survey: SUMMARY | ||||||
|---|---|---|---|---|---|---|
| 12 MO | Since Oct-88 | Percentile | ||||
| Sep-09 | Aug-09 | Jul-09 | AVERAGE | Average | rank/range | |
| Production-latest mo | ||||||
| Total Industry | 0.59 | -0.77 | 0.16 | -10 | 6 | 38.0% |
| Production Outlook | ||||||
| Total Industry | 1.23 | -1.36 | 3.47 | -7 | 6 | 31.2% |
| Demand | ||||||
| Overall order books | -32.7 | -37.41 | -40.73 | -42 | 1 | 16.3% |
| Foreign Orders | 1.08 | -0.46 | -2.01 | -14 | 6 | 19.8% |
| New Orders | ||||||
| Total Industry | -2.61 | 4.35 | 2.89 | -12 | 7 | 29.0% |
| Stocks: Finished Gds | ||||||
| Total Industry | -6.21 | -8.13 | -5.44 | -5 | -2 | 19.4% |
| Capacity Utilization | 71.73 | 70.76 | 70.8 | 71 | 77 | 7.1% |
| Hiring | ||||||
| Latest Mo | -1.9 | -0.57 | -7.05 | -9 | -5 | 59.8% |
| Outlook | -7.6 | -9.98 | -8.13 | -14 | -8 | 52.2% |
| Industry Sentiment Index | 92.14 | 89.09 | 87.59 | 79 | 90 | 30.0% |

Tom Moeller
AuthorMore in Author Profile »Prior to joining Haver Analytics in 2000, Mr. Moeller worked as the Economist at Chancellor Capital Management from 1985 to 1999. There, he developed comprehensive economic forecasts and interpreted economic data for equity and fixed income portfolio managers. Also at Chancellor, Mr. Moeller worked as an equity analyst and was responsible for researching and rating companies in the economically sensitive automobile and housing industries for investment in Chancellor’s equity portfolio. Prior to joining Chancellor, Mr. Moeller was an Economist at Citibank from 1979 to 1984. He also analyzed pricing behavior in the metals industry for the Council on Wage and Price Stability in Washington, D.C. In 1999, Mr. Moeller received the award for most accurate forecast from the Forecasters' Club of New York. From 1990 to 1992 he was President of the New York Association for Business Economists. Mr. Moeller earned an M.B.A. in Finance from Fordham University, where he graduated in 1987. He holds a Bachelor of Arts in Economics from George Washington University.
More Economy in Brief


