 Global| Nov 12 2009
U.S. Weekly Initial JoblessInsurance Claims Fall Again To 2009 Low
by:Tom Moeller
|in:Economy in Brief
Summary
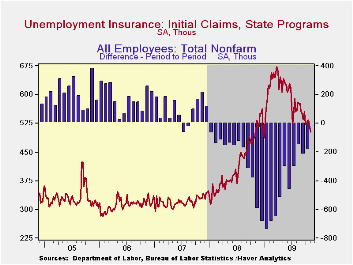
U.S. job market continues to improve. That's the message from the Labor Department's report of another decline last week in initial claims for jobless insurance. They're down to 502,000 from 514,000 during the prior week which was [...]
 U.S. job
market continues to improve. That's the message from the Labor
Department's report of another decline last week in initial claims for
jobless insurance. They're down to 502,000 from 514,000 during the
prior week which was revised up from 512,000. The latest figures are
the lowest of this year and are down sharply from the March peak of
674,000 claims. The four-week moving average of claims fell to 519,750
and the latest weekly figure was lower than Consensus expectations for
510,000.
U.S. job
market continues to improve. That's the message from the Labor
Department's report of another decline last week in initial claims for
jobless insurance. They're down to 502,000 from 514,000 during the
prior week which was revised up from 512,000. The latest figures are
the lowest of this year and are down sharply from the March peak of
674,000 claims. The four-week moving average of claims fell to 519,750
and the latest weekly figure was lower than Consensus expectations for
510,000.
 Continuing
claims for unemployment insurance during the
latest week fell a sharp 139,000 to the lowest level since mid-March.
The decline reflects the improved job market but may also be a function
of the exhaustion of benefits. Continuing claims provide an indication
of workers' ability to find employment. The four-week average of
continuing claims fell modestly to 5,790,750 and have fallen 14.5% from
their peak. This series dates back to 1966. Extended benefits
for unemployment insurance fell and reversed the prior week's increase.
Through late-October extended benefits averaged 523,061.
Continuing
claims for unemployment insurance during the
latest week fell a sharp 139,000 to the lowest level since mid-March.
The decline reflects the improved job market but may also be a function
of the exhaustion of benefits. Continuing claims provide an indication
of workers' ability to find employment. The four-week average of
continuing claims fell modestly to 5,790,750 and have fallen 14.5% from
their peak. This series dates back to 1966. Extended benefits
for unemployment insurance fell and reversed the prior week's increase.
Through late-October extended benefits averaged 523,061.
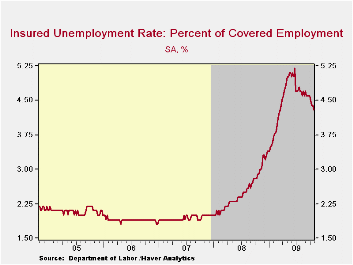
The insured rate of unemployment slipped 4.3%, the lowest since mid-March. The rate reached a high of 5.2% during late-June. During the last ten years, there has been a 93% correlation between the level of the insured unemployment rate and the overall rate of unemployment published by the Bureau of Labor Statistics.
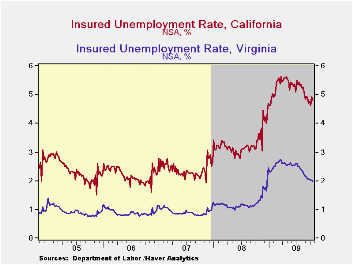 The
highest insured unemployment
rates in the week ending October 24 were in Puerto Rico (6.4%), Oregon
(5.4), Nevada (5.2), Pennsylvania (4.9), California (4.8), Arkansas
(4.8), Wisconsin (4.8), Alaska (4.8), Michigan (4.5), North Carolina
(4.5), and South Carolina (4.5). The lowest insured unemployment rates
were in North Dakota (1.1%), South Dakota (1.1), Virginia (2.0),
Wyoming (2.6), Maine (2.5), Texas (2.5), Colorado (2.9), Maryland
(3.2), Mississippi (3.5), New York (3.5), Georgia (3.7) and Florida
(3.8).
The
highest insured unemployment
rates in the week ending October 24 were in Puerto Rico (6.4%), Oregon
(5.4), Nevada (5.2), Pennsylvania (4.9), California (4.8), Arkansas
(4.8), Wisconsin (4.8), Alaska (4.8), Michigan (4.5), North Carolina
(4.5), and South Carolina (4.5). The lowest insured unemployment rates
were in North Dakota (1.1%), South Dakota (1.1), Virginia (2.0),
Wyoming (2.6), Maine (2.5), Texas (2.5), Colorado (2.9), Maryland
(3.2), Mississippi (3.5), New York (3.5), Georgia (3.7) and Florida
(3.8).
The unemployment insurance claims data is available in Haver's WEEKLY database and the state data is in the REGIONW database.
The Exchange Rate: What's in It for Prices? from the Federal Reserve Bank of Philadelphia is available here.
| Unemployment Insurance (000s) | 11/07/09 | 10/31/09 | 10/24/09 | Y/Y | 2008 | 2007 | 2006 |
|---|---|---|---|---|---|---|---|
| Initial Claims | 502 | 514 | 532 | -1.4% | 420 | 321 | 313 |
| Continuing Claims | -- | 5,631 | 5,770 | 43.2% | 3,342 | 2,552 | 2,459 |
| Insured Unemployment Rate (%) | -- | 4.3 | 4.4 | 3.1 (11/'08) | 2.5 | 1.9 | 1.9 |
U.S. Weekly Mortgage Applications Rise Overall But Purchases Slacken
by Tom Moeller November 12, 2009
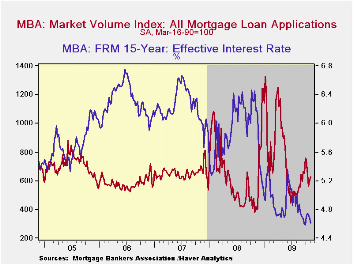
The Mortgage Bankers Association indicated that mortgage applications rose 3.2% last week and remained up by nearly one-half from last year. But the overall figure masks conflicting trends between mortgage applications for purchase (down) and for refinance (up).
Applications to purchase a home fell hard for the fifth consecutive week and they are down by one-quarter during the period. The decline, no doubt, partially reflects the expiration of an up-to $8,000 Federal tax credit for first-time homebuyers. The credit, however, was recently extended to April of next year. During the last ten years there has been a 51% correlation between the y/y change in purchase applications and the change in new plus existing single family home sales. The correlation has lessened recently. Applications to refinance mortgages rose solidly last week and were up by one-half from the June low due to declines in interest rates.
The effective interest rate on conventional 15-year mortgages
fell last week to 4.61% which is near the recent low and down from the
June average of 5.21%. For 30-year mortgages, the rate also fell last
week to 5.11% after reaching a high of 5.79% in early-June. Interest
rates on 15-year and 30-year mortgages are closely correlated
(>90%) with the rate on 10-year Treasury securities. Rates on
adjustable one-year mortgages rose to 6.94% last week which was the
highest level since November of last year.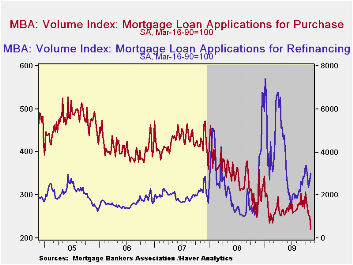
During the last twelve months, the number of fixed-rate mortgage applications has risen 43.0% while the number of adjustable-rate mortgage applications has roughly tripled.
The Mortgage Bankers Association surveys between 20 to 35 of the top lenders in the U.S. housing industry to derive its refinance, purchase and market indexes. The weekly survey covers roughly 50% of all U.S. residential mortgage applications processed each week by mortgage banks, commercial banks and thrifts. Visit the Mortgage Bankers Association site here.The figures for weekly mortgage applications are available in Haver's SURVEYW database.
Unequal We Stand: An Empirical Analysis of
Economic Inequality in the United States, 1967–2006 from
the Federal Reserve Bank of Minneapolis can be found here.
| MBA Mortgage Applications (SA, 3/16/90=100) | 11/06/09 | 10/30/09 | Y/Y | 2008 | 2007 | 2006 |
|---|---|---|---|---|---|---|
| Total Market Index | 627.5 | 608.3 | 47.6% | 642.9 | 652.6 | 584.2 |
| Purchase | 220.9 | 250.3 | -22.3 | 345.4 | 424.9 | 406.9 |
| Refinancing | 2,998.2 | 2,693.7 | 140.2 | 2,394.1 | 1,997.9 | 1,634.0 |
| 15-Year Effective Interest Rate (%) | 4.61% | 4.67% | 5.98% (11/08) | 5.9% | 6.2% | 6.3% |
EMU MFG Still Digging Its Way Out
by Robert Brusca November 12, 2009
MFG IP in the e-Zone rose in September laying a foundation for
continued economic recovery. Over three months the annual rate of IP
growth is now 1.9% compared to flat over six months and lower by 13.8%
over 12-months.
To be sure the lift off in IP is less than in indicators such
as the Markit MFG PMI index or the jump in orders. But it takes longer
for actual output to be put to work than for indicators of improvement
to show progress. The large countries are showing more rapid increases
in growth than is EMU as a whole.
For Germany three-month growth is up at an 18.7% annual rate;
that is surpassed by the ever volatile results from Spain that
skyrocketed at a 29% pace over three months. France is up at an 8%
pace; Italy is up at a 4% pace. EU member the UK is lagging as it has
MFG IP up at a tiny 0.5% pace over three-months. For this group
six-month growth rates are all positive and the three-month results
show acceleration compared to six months. Over 12-months IP in all
countries still is falling rapidly, at a double-digit pace.
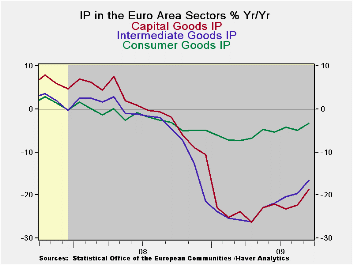
By industry the consumer sector continues to lag. Consumer
durables output is off on the month and over three months it is down by
-2.1% countered by a three-month rise of 1.6% in consumer nondurables
output. Capital goods output is up at a 6.6% pace over three-months.
Intermediate goods output is flying at a 13% annual rate of expansion
as commodities and raw goods lead the cycle
These figures confirm the trend we already have seen.
Consumers are lagging and raw goods are rising strongly. Investment is
picking up. Still consumer sentiment is one of the stronger barometers
for EMU even though consumer spending and the output of consumer goods
has been lagging.
| E-zone MFG IP | ||||||||||
|---|---|---|---|---|---|---|---|---|---|---|
| Saar except m/m | Mo/Mo | Sep 09 |
Aug 09 |
Sep 09 |
Aug 09 |
Sep 09 |
Aug 09 |
|||
| Ezone Detail | Sep 09 |
Aug 09 |
Jul 09 |
3Mo | 3Mo | 6Mo | 6Mo | 12Mo | 12Mo | Q-3 |
| MFG | 0.3% | 0.3% | -0.1% | 1.9% | 0.0% | 0.0% | -2.3% | -13.8% | -16.5% | 0.9% |
| Consumer | 0.3% | -0.4% | 0.5% | 1.4% | -0.8% | 1.7% | -0.6% | -3.2% | -4.9% | 1.0% |
| C-Durables | -6.0% | 5.2% | 0.6% | -2.1% | 8.3% | -10.7% | -4.2% | -19.2% | -15.0% | -- |
| C-Non-durables | 1.1% | -1.1% | 0.4% | 1.6% | -1.9% | 3.4% | 0.4% | -0.8% | -3.4% | -- |
| Intermediate | 0.6% | 1.0% | 1.4% | 13.0% | 13.4% | 10.7% | 7.3% | -16.6% | -19.6% | 14.1% |
| Capital | 1.7% | 1.4% | -1.4% | 6.6% | 0.5% | 3.0% | 0.2% | -18.7% | -22.2% | 2.1% |
| Main E-zone Countries and UK IP in MFG | ||||||||||
| Mo/Mo | Sep 09 |
Aug 09 |
Sep 09 |
Aug 09 |
Sep 09 |
Aug 09 |
||||
| MFG Only | Sep 09 |
Aug 09 |
Jul 09 |
3Mo | 3Mo | 6Mo | 6Mo | 12Mo | 12Mo | Q:3 Date |
| Germany: | 3.2% | 2.1% | -1.0% | 18.4% | 7.1% | 14.9% | 9.6% | -14.3% | -19.2% | 15.2% |
| France:IPx Construct'n | -1.5% | 2.8% | 0.7% | 8.0% | 15.5% | 6.3% | 7.2% | -10.4% | -10.0% | 12.2% |
| Italy | -5.7% | 5.9% | 1.1% | 4.0% | 32.7% | 3.0% | 5.9% | -16.9% | -13.5% | 12.9% |
| Spain | 0.7% | -3.0% | 9.1% | 29.2% | 47.0% | 19.5% | 6.9% | -12.4% | -10.6% | 33.1% |
| UK: EU member | 1.7% | -2.0% | 0.4% | 0.5% | -4.0% | 0.2% | -2.5% | -9.4% | -11.6% | -0.5% |

Tom Moeller
AuthorMore in Author Profile »Prior to joining Haver Analytics in 2000, Mr. Moeller worked as the Economist at Chancellor Capital Management from 1985 to 1999. There, he developed comprehensive economic forecasts and interpreted economic data for equity and fixed income portfolio managers. Also at Chancellor, Mr. Moeller worked as an equity analyst and was responsible for researching and rating companies in the economically sensitive automobile and housing industries for investment in Chancellor’s equity portfolio. Prior to joining Chancellor, Mr. Moeller was an Economist at Citibank from 1979 to 1984. He also analyzed pricing behavior in the metals industry for the Council on Wage and Price Stability in Washington, D.C. In 1999, Mr. Moeller received the award for most accurate forecast from the Forecasters' Club of New York. From 1990 to 1992 he was President of the New York Association for Business Economists. Mr. Moeller earned an M.B.A. in Finance from Fordham University, where he graduated in 1987. He holds a Bachelor of Arts in Economics from George Washington University.
More Economy in Brief


