 Global| Oct 22 2009
U.S. Weekly Initial Claims ForJobless Insurance Rise But Trend Continues Down
by:Tom Moeller
|in:Economy in Brief
Summary
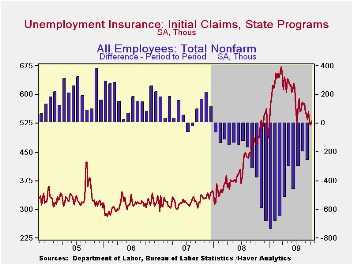
The recent improvement in the labor market stalled last week, but the trend toward improvement seems still in place. The Labor Department indicated that initial claims for unemployment insurance increased to 531,000 from 520,000, [...]
 The recent
improvement in the labor market stalled last week, but the trend toward
improvement seems still in place. The Labor Department indicated that
initial claims for unemployment insurance increased to 531,000 from
520,000, initially reported at 514,000, during the prior week. The
latest figure included the Columbus Day holiday. Both of the latest are
down from the September average of 549,000 claims and are down sharply
from the peak reached in March of 674,000 claims. The four-week moving
average of claims fell to 532,250 while the latest weekly figure was
slightly higher than Consensus expectations for 517,000 claims.
The recent
improvement in the labor market stalled last week, but the trend toward
improvement seems still in place. The Labor Department indicated that
initial claims for unemployment insurance increased to 531,000 from
520,000, initially reported at 514,000, during the prior week. The
latest figure included the Columbus Day holiday. Both of the latest are
down from the September average of 549,000 claims and are down sharply
from the peak reached in March of 674,000 claims. The four-week moving
average of claims fell to 532,250 while the latest weekly figure was
slightly higher than Consensus expectations for 517,000 claims.
 Congress
is considering legislation that would extend the period of
receiving jobless insurance benefits. The House has approved an
extension, but the Senate has not yet voted on it.
Congress
is considering legislation that would extend the period of
receiving jobless insurance benefits. The House has approved an
extension, but the Senate has not yet voted on it.
The latest claims figure covers the survey period for October payroll employment. Initial claims fell 19,000 (3.5%) from the September period. During the last ten years their has been an eighty-six percent correlation between the level of initial claims and the m/m change in payroll employment.
The largest decreases in initial claims during the week ending October 10 were in Florida (+9,976, 16.5% y/y), New York (+5,411, 4.5% y/y), Wisconsin (+4,999, 63.1% y/y), Indiana (+4,977, 19.2% y/y), and Arkansas (+4,704, 35.5% y/y), while the largest decreases were in California (-7,062, -2.5% y/y), Tennessee (-294, +7.7% y/y), Maine (-140, +19.3% y/y), and Nebraska (-34, +0.9% y/y).
Continuing claims for unemployment insurance during the latest week fell 98,000 to their lowest level since late-March. The decline continues to owe partially to the exhaustion of benefits. Continuing claims provide an indication of workers' ability to find employment. The four-week average of continuing claims fell modestly to 6,030,750 and have fallen 11.0% from their peak. This series dates back to 1966.
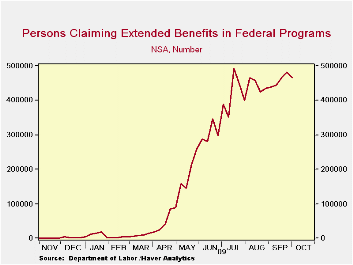 Extended
benefits for unemployment insurance
fell slightly for the first decline in six weeks. Through early-October
extended benefits averaged 464,788.
Extended
benefits for unemployment insurance
fell slightly for the first decline in six weeks. Through early-October
extended benefits averaged 464,788.
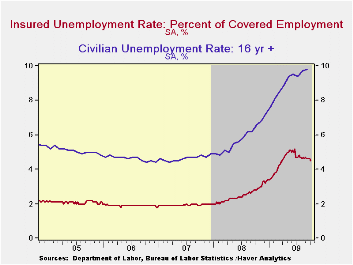
The insured rate of unemployment slipped to 4.5%, from an upwardly revised 4.6%, and matched its lowest since early-April. The rate reached a high of 5.2% during late-June. During the last ten years, there has been a 93% correlation between the level of the insured unemployment rate and the overall rate of unemployment published by the Bureau of Labor Statistics.
The lowest insured unemployment rates during the week ending October 3 were in North Dakota (1.0%), South Dakota (1.0), Virginia (2.1), Wyoming (2.4), Maine (2.5), Texas (2.5), Colorado (2.9), Minnesota (3.0), Maryland (3.1), Mississippi (3.5), New York (3.5), Florida (3.8), and Georgia (3.9). The highest insured unemployment rates were in Puerto Rico (6.6), Oregon (5.3), Nevada (5.2), Pennsylvania (4.9), California (4.8), Michigan (4.7), Wisconsin (4.7), North Carolina (4.6), South Carolina (4.5), and Washington (4.5).
The unemployment insurance claims data is available in Haver's WEEKLY database and the state data is in the REGIONW database.· The Fed's latest Beige Book covering regional economic conditions can be found here.
| Unemployment Insurance (000s) | 10/16/09 | 10/09/09 | 10/02/09 | Y/Y | 2008 | 2007 | 2006 |
|---|---|---|---|---|---|---|---|
| Initial Claims | 531 | 520 | 524 | 10.9% | 420 | 321 | 313 |
| Continuing Claims | -- | 5,923 | 6,021 | 57.6% | 3,342 | 2,552 | 2,459 |
| Insured Unemployment Rate (%) | -- | 4.5 | 4.6 | 2.8 (10/2008) | 2.5 | 1.9 | 1.9 |
by Tom Moeller October 22, 2009
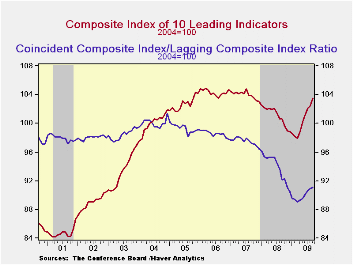
The Conference Board's Index of Leading Economic Indicators suggested pending economic recovery with a 1.0% September increase that was the sixth consecutive monthly rise. The 5.7% increase during those six months was the strongest since early-1983 and the index itself was at the highest level since October 2007. The leading index is based on actual reports for eight economic data series. The Conference Board initially estimates two series, orders for consumer goods and orders for capital goods.
The breadth of the increase amongst the component series was
impressive last month. Eighty percent of the components rose, led by a
steeper yield curve, higher consumer expectations, lower initial claims
for jobless insurance and higher stock prices. These gains were offset
slightly by shorter weekly hours worked and lower building permits.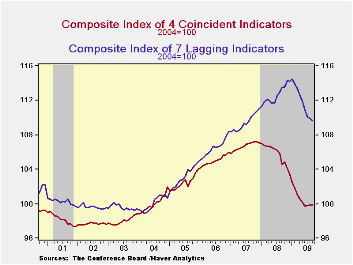
Continuing to suggest that the rate of decline in the economy is slowing were the coincident indicators. They were unchanged during September after a modest 0.1% August gain. These declines compare with monthly shortfalls of 0.6%-to-1.1% dating back to September. Fostering the turnaround have been slight increases in industrial production, real personal income and higher business sales, as well as diminished monthly declines in payrolls.
In a continued sign that excesses in the U.S. economy are falling, the lagging index fell for the ninth month in the last ten. Commercial and industrial loans outstanding fell sharply for the tenth straight month and consumer credit versus personal income was off for the sixth month this year. Regardless, the average duration of unemployment shortened and the change in CPI for services eased. The ratio of coincident-to-lagging indicators (a measure of economic excess) also continued higher for the sixth straight month to the highest level since November.
The Conference Board figures are available in Haver's BCI database. Visit the Conference Board's site for coverage of leading indicator series from around the world.
| Business Cycle Indicators (%) | September | August | July | June 6-Month % (AR) | 2008 | 2007 | 2006 |
|---|---|---|---|---|---|---|---|
| Leading | 1.0 | 0.4 | 1.0 | 11.8 | -2.8 | -0.3 | 1.5 |
| Coincident | 0.0 | 0.1 | 0.1 | -2.2 | -0.9 | 1.6 | 2.5 |
| Lagging | -0.3 | -0.2 | -0.6 | -6.4 | 2.9 | 2.8 | 3.3 |
by Robert Brusca October 22, 2009
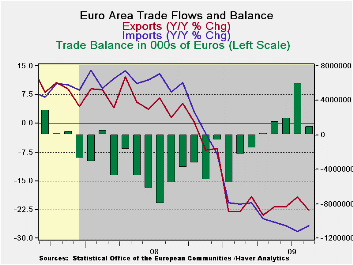
The EMU surplus in trade shrank in August at exports fell a
sharp 5.8% in the month and imports skittered lower by 1.3%. While
exports are down by a heft 22.8% Yr/Yr their annual rate of decline is
cut to the 3% to 4% range over three and six months. While that is a
sharp improvement but it still is not growth. Imports are off by
26.&% Yr/Yr and at a -9.7% pace over six months but over three
months imports are barely lower falling at an annualized rate of -0.8%.
It is too soon to make anything of significance out of these
differences in growth rates. Italy, however, has seen its exports to
China drop with the sharpest drop in exports to Russia, the US, and
OPEC countries. Timely data on the geography of exports is spotty. But
we have seen Italy and Germany report some irregular export and export
orders figures recently. In August exports were down across the board
in EMU. Few categories show anything but continued deceleration from
6-months to three months although the progress compared to Yr/Yr rates
of growth is obvious and very strong. Imports show a clearer, steadier,
more widespread picture of growth rates that are cutting their pace of
decline.
On balance trade is not the clear homerun it had appeared to
be early in the cycle. Some irregularities are cropping up in trade
flows and in measures of international export orders.
| E-zone Trade trends for goods | ||||||
|---|---|---|---|---|---|---|
| m/m% | % Saar | |||||
| Aug-09 | Jul-09 | 3M | 6M | 12M | 12M Ago | |
| Balance* | €€ 995 | €€ 6,000 | €€ (6,370) | €€ 1,505 | €€ (2,779) | €€ 1,666 |
| Exports | ||||||
| All Exp | -5.8% | 4.7% | -2.9% | -3.8% | -22.8% | 1.5% |
| Food and Drinks | -6.5% | 3.4% | -10.4% | -5.0% | -12.2% | 2.1% |
| Raw materials | -6.1% | 6.0% | -3.5% | 27.3% | -21.5% | 7.1% |
| Other | -5.8% | 4.8% | -2.2% | -4.3% | -23.5% | 1.4% |
| MFG | -8.9% | 8.2% | -11.8% | -8.6% | -25.3% | -1.8% |
| IMPORTS | ||||||
| All IMP | -1.3% | 0.8% | -0.8% | -9.7% | -26.7% | 8.3% |
| Food and Drinks | -5.1% | 1.1% | -17.9% | -13.8% | -13.9% | 8.6% |
| Raw materials | 1.2% | 2.1% | 16.6% | -12.4% | -39.5% | 8.0% |
| Other | -1.1% | 0.7% | -0.1% | -9.3% | -26.8% | 8.3% |
| MFG | -1.8% | 0.6% | -10.8% | -12.1% | -23.5% | -2.3% |
| *Eur mlns; mo or period average | ||||||

Tom Moeller
AuthorMore in Author Profile »Prior to joining Haver Analytics in 2000, Mr. Moeller worked as the Economist at Chancellor Capital Management from 1985 to 1999. There, he developed comprehensive economic forecasts and interpreted economic data for equity and fixed income portfolio managers. Also at Chancellor, Mr. Moeller worked as an equity analyst and was responsible for researching and rating companies in the economically sensitive automobile and housing industries for investment in Chancellor’s equity portfolio. Prior to joining Chancellor, Mr. Moeller was an Economist at Citibank from 1979 to 1984. He also analyzed pricing behavior in the metals industry for the Council on Wage and Price Stability in Washington, D.C. In 1999, Mr. Moeller received the award for most accurate forecast from the Forecasters' Club of New York. From 1990 to 1992 he was President of the New York Association for Business Economists. Mr. Moeller earned an M.B.A. in Finance from Fordham University, where he graduated in 1987. He holds a Bachelor of Arts in Economics from George Washington University.