 Global| Feb 23 2010
U.S. Weekly Gasoline PricesRecoverSomewhat
by:Tom Moeller
|in:Economy in Brief
Summary
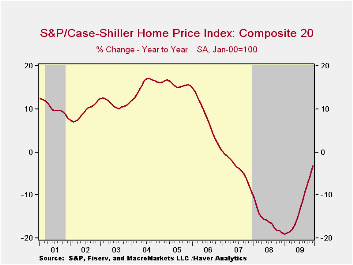
Ever-so-slightly, home prices are rising m/m and the annual decline has eased. The December S&P/Case Shiller Home Price Index edged up another 0.3% and they have risen 3.6% from the May low. That improvement pared the 12-month price [...]
 Ever-so-slightly,
home prices are rising m/m and the annual decline has
eased. The December S&P/Case Shiller Home Price Index edged up
another 0.3% and they have risen 3.6% from the May low. That
improvement pared the 12-month price decline to 3.1% from its worst of
-19.0% last January. For 2009 as a whole, prices fell 13.3% and they
have fallen 29.4% from the early-2006 peak.
Ever-so-slightly,
home prices are rising m/m and the annual decline has
eased. The December S&P/Case Shiller Home Price Index edged up
another 0.3% and they have risen 3.6% from the May low. That
improvement pared the 12-month price decline to 3.1% from its worst of
-19.0% last January. For 2009 as a whole, prices fell 13.3% and they
have fallen 29.4% from the early-2006 peak.
The narrower 10 City Composite Index also gained 0.3% following three months of 0.2% increase. As a result, the 12-month decline eased to -2.4% from -19.4% at its worst. These negative comparisons by far outpace those during the 1990-91 recession when home prices fell 6.3%.
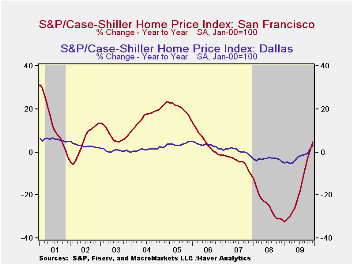
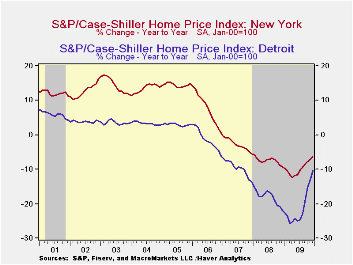
The performance of home prices has been quite varied around the country. During December, price gains near or above 1.0% were logged in Boston, Las Vegas, San Diego, San Francisco and Phoenix but prices still fell in Chicago, Miami, New York, Cleveland, and Tampa.
The Case Shiller home price series are value-weighted, i.e., a greater index weight is assigned to more expensive homes. The S&P/Case-Shiller home price series can be found in Haver's USECON database and the city data highlighted below is in the REGIONAL database.
Mortgage Choice and the Pricing of Fixed-Rate and Adjustable-Rate Mortgages from the Federal Reserve Bank of San Francisco is available here here.
| S&P/Case-Shiller Home Price Index (SA, Jan 00 = 100) | December m/m | November m/m | October m/m | Dec. y/y | 2009 | 2008 | 2007 |
|---|---|---|---|---|---|---|---|
| 20 City Composite Index | 0.3% | 0.3% | 0.2% | -3.1% | -13.3% | -15.7% | -3.8% |
| Regional Indicators | |||||||
| Atlanta | -0.0 | 0.2 | -0.3 | -3.9 | -11.6 | -8.5 | 0.7 |
| Boston | 0.9 | 0.5 | -0.3 | 0.5 | -4.9 | -5.7 | -4.0 |
| Chicago | -0.6 | -0.6 | -1.1 | -7.2 | -14.2 | -10.0 | -1.0 |
| Dallas | 0.1 | 0.6 | 0.2 | 3.0 | -2.3 | -3.2 | 0.5 |
| Denver | 0.1 | 0.2 | 0.3 | 1.2 | -2.8 | -4.9 | -1.7 |
| Los Angeles | 1.4 | 1.2 | 0.7 | -0.1 | -15.4 | -24.2 | -5.2 |
| New York | -0.5 | -0.9 | -0.4 | -6.3 | -9.8 | -7.4 | -2.8 |
| San Francisco | 1.0 | 1.2 | 1.7 | 4.8 | -18.4 | -24.3 | -4.5 |
by Tom Moeller February 23, 2010
 Continuing
to move generally in a sideways pattern, the pump price for
regular gasoline rose last week to $2.66. Nevertheless,
prices remained up by more than one-third from last year. Yesterday,
the spot market price for a gallon of regular gasoline rose to its
highest level since January. The figures are reported by the U.S.
Department of Energy and can be found in Haver's WEEKLY
& DAILY databases.
Continuing
to move generally in a sideways pattern, the pump price for
regular gasoline rose last week to $2.66. Nevertheless,
prices remained up by more than one-third from last year. Yesterday,
the spot market price for a gallon of regular gasoline rose to its
highest level since January. The figures are reported by the U.S.
Department of Energy and can be found in Haver's WEEKLY
& DAILY databases.
The price for a barrel of light
sweet crude (WTI) oil recovered prior weakness and rose last week to
$78.30. Nevertheless, it was down from the early-January high of
$82.59. Yesterday, the spot price was up further to $80.16. 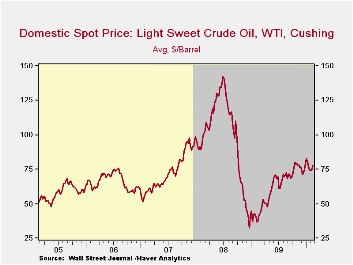 Prices have
risen from $71.53 early this past December and are more than double the
December 2008 low of $32.37.
Prices have
risen from $71.53 early this past December and are more than double the
December 2008 low of $32.37.
Demand for gasoline fell 3.0% last week versus one year ago. That decline compared to a 3.9% increase at the beginning of October. Breaking away from earlier y/y strength, the demand for residual fuel oil fell 3.7% y/y. Distillate demand fell 12.3% y/y, a decline more moderate than the 21.6% y/y shortfall at the beginning of last July. Inventories of crude oil and petroleum products slipped in February but were up 0.7% from one year ago.
U.S. natural gas prices have been roughly flat this year as temperatures have been volatile. They fell to an average $5.40 per mmbtu (+25.21% y/y) from the high of $6.50 early in January. Nevertheless they remained double the September low.
The energy price data can be found in Haver's WEEKLY database while the daily figures are in DAILY. The gasoline demand figures are in OILWKLY.
| Weekly Prices | 02/22/10 | 02/15/10 | 02/08/10 | Y/Y | 2009 | 2008 | 2007 |
|---|---|---|---|---|---|---|---|
| Retail Regular Gasoline ($ per Gallon, Regular) | 2.66 | 2.61 | 2.65 | 39.1% | 2.35 | 3.25 | 2.80 |
| Light Sweet Crude Oil, WTI ($ per bbl.) | 78.30 | 73.91 | 74.59 | 111.7% | 61.39 | 100.16 | 72.25 |
by Tom Moeller February 23, 2010
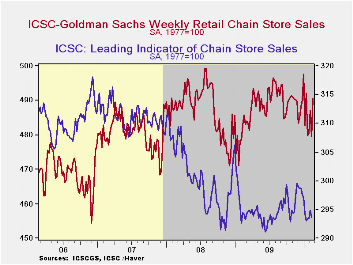
Consumer spending has yet to show real spark. Weekly chain store sales improved by 2.3% last week but for the month so far sales remained down slightly from the January average. Sales also remained down 1.6% from last summer's high.
The ICSC-Goldman Sachs retail chain-store sales index is constructed using the same-store sales (stores open for one year) reported by 78 stores of seven retailers: Dayton Hudson, Federated, Kmart, May, J.C. Penney, Sears and Wal-Mart.
During the last ten years there has been a 69% correlation between the year-to-year growth in chain store sales and the growth in general merchandise retail sales. The weekly figures are available in Haver's SURVEYW database.Also treading water has been the leading indicator of chain store sales. It's been roughly unchanged since early-January and flat for the last year. This composite leading economic indicator is compiled from four series: (1) the MBA's volume index of mortgage applications for home purchase (2) the ABC News/Money magazine's survey of consumer buying conditions (3) new filings for jobless benefits and (4) the 30-year government bond yield.
| ICSC-UBS (SA, 1977=100) | 02/20/10 | 02/13/10 | 02/06/10 | Y/Y | 2009 | 2008 | 2007 |
|---|---|---|---|---|---|---|---|
| Total Weekly Chain Store Sales | 490.4 | 479.5 | 487.1 | 0.9% | 0.1% | 1.4% | 2.8% |
by Louise Curley February 23, 2010
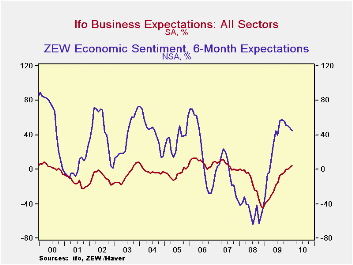
German business confidence, which had been improving since March 2009, declined slightly in February. On a percent balance measure, which subtracts the percentage of respondents who are negative from those who are positive, confidence among German entrepreneurs fell to -10.3% from -9.0%. The climate measure is a combination of the business opinions regarding current conditions and expectations for the next six months.. The percent balance of business opinion on current conditions fell to -23.8% in February from -21.0% in January. Much of the decline can probably be attributed to the weather. Heavy snow fall and cold temperatures were particularly bad for construction and the distributive trades, both wholesale and retail.
In spite of the fact that the pessimists have exceeded the optimists regarding current conditions by more than 20% over the past several months, the proportion of German entrepreneurs who expect better condition six months ahead has been increasing. In December there was a slight excess of optimists over pessimists of 0.3%. In February the percent balance on expectations increased to 4.2% from 3.8% in January.
The increase in the proportion of business people who expect better conditions is in sharp contrast to the declines in the proportion of financial people who expect better conditions as revealed last Week in the ZEW survey. Not only do the business and financial communities sometimes differ in their appraisals of the future, but, they apparently differ in temperament, as shown in the attached chart which compares the percent balances on expectations of the two surveys. The financial community appears to have a positive bias and to have wide mood swings while the business community tends to have a negative bias and more restrained mood swings. In statistical terms--over entire history of each of the two series--the mean of the ZEW series is 27.1% and its standard deviation, 40.6%; the mean of the IFO series is -5.2% and its standard deviation, 10.6%
| GERMANY | Feb 10 | Jan 10 | Dec 09 | Nov 09 | Oct 09 | Sep 09 | Low | Date |
|---|---|---|---|---|---|---|---|---|
| IFO: Climate (% Bal.) | -10.3 | -9.0 | -16.5 | -12.9 | -16.5 | -17.8 | -36.0 | Mar 09 |
| Current Conditions (% Bal.) | -23.8 | -21.0 | -22.5 | -24.9 | -28.4 | -29.0 | -38.1 | Jun 09 |
| Expectations (% Bal.) | 4.2 | 3.8 | 0.3 | 0.0 | -3.9 | -5.9 | -44.8 | Dec 08 |
| ZEW: Expectations (% Bal.) | 45.1 | 47.2 | 50.4 | 51.1 | 56.0 | 57.7 | -63.0 | Oct 08 |
by Tom Moeller February 23, 2010
 There
was a
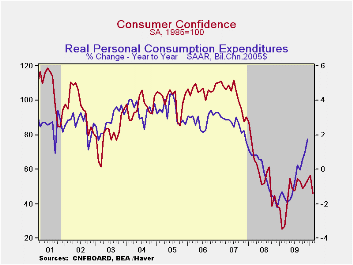
slowing of retail sales during December and January. More weakness may
be in the offing given the latest souring of consumers' mood. For
February, the Conference Board reported that consumer confidence fell
18.6% from January and that brought down the level of confidence to its
lowest since last April. Just a modest m/m decline had been the
Consensus expectation for February and during the last ten years there
has been an 83% correlation between the level of consumer confidence
and the y/y change in real consumer spending. The Conference Board data
can be found in Haver's CBDB database.
There
was a
slowing of retail sales during December and January. More weakness may
be in the offing given the latest souring of consumers' mood. For
February, the Conference Board reported that consumer confidence fell
18.6% from January and that brought down the level of confidence to its
lowest since last April. Just a modest m/m decline had been the
Consensus expectation for February and during the last ten years there
has been an 83% correlation between the level of consumer confidence
and the y/y change in real consumer spending. The Conference Board data
can be found in Haver's CBDB database.
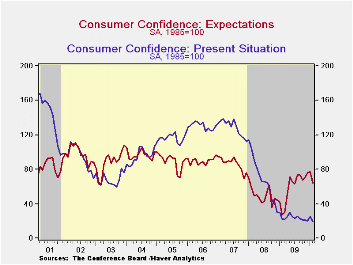
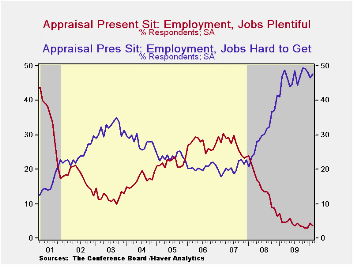
Consumers' assessment of current economic conditions slumped by nearly one-quarter m/m. That reversed all of a January increase and left the measure near the historic low. Jobs were seen as hard to get by 47.7% of respondents and jobs were seen as plentiful by only 3.6%. That was up just slightly from the series' historic low. Also at a record low was the percentage of respondents who saw business conditions as good. The percentage of consumers who thought business conditions were bad rose to 46.3%, off somewhat from its peak but nearly the highest since 1983.
The expectations component of confidence also fell sharply to its lowest level since April. Lessened expectations for business conditions, employment and income have led the latest downdraft. Expectations for the inflation rate in twelve months held stable at 5.2%, the lowest level since 2007 and down from last year's high of 7.7%. Interest rates in twelve months were expected to be higher by 52.2% of respondents while 14.2% expected rates to fall. A greatly lessened 28.6% of respondents expected stock prices to rise.
An improved 2.7% of those surveyed plan to buy a home during the next six months. An increased 27.1% plan to buy a major appliance versus 30.9% back in 2007. Only 4.8% plan to buy an automobile versus 6.0% in 2007 and just 1.8% plan to buy a new one.
| Conference Board (SA, 1985=100) | February | January | December | Y/Y % | 2009 | 2008 | 2007 |
|---|---|---|---|---|---|---|---|
| Consumer Confidence Index | 46.0 | 56.5 | 53.6 | 81.8 | 45.2 | 57.9 | 103.4 |
| Present Situation | 19.4 | 25.2 | 20.2 | -13.0 | 24.0 | 69.9 | 128.8 |
| Expectations | 63.8 | 77.3 | 75.9 | 133.7 | 59.3 | 50.0 | 86.4 |

Tom Moeller
AuthorMore in Author Profile »Prior to joining Haver Analytics in 2000, Mr. Moeller worked as the Economist at Chancellor Capital Management from 1985 to 1999. There, he developed comprehensive economic forecasts and interpreted economic data for equity and fixed income portfolio managers. Also at Chancellor, Mr. Moeller worked as an equity analyst and was responsible for researching and rating companies in the economically sensitive automobile and housing industries for investment in Chancellor’s equity portfolio. Prior to joining Chancellor, Mr. Moeller was an Economist at Citibank from 1979 to 1984. He also analyzed pricing behavior in the metals industry for the Council on Wage and Price Stability in Washington, D.C. In 1999, Mr. Moeller received the award for most accurate forecast from the Forecasters' Club of New York. From 1990 to 1992 he was President of the New York Association for Business Economists. Mr. Moeller earned an M.B.A. in Finance from Fordham University, where he graduated in 1987. He holds a Bachelor of Arts in Economics from George Washington University.
More Economy in Brief


