 Global| Dec 18 2008
U.S. Weekly Claims For Unemployment Insurance Dipped
by:Tom Moeller
|in:Economy in Brief
Summary
Last week, initial claims for unemployment insurance dipped by an expected 21,000. The decline to 554,000, however, reversed only a third of the prior week's 60,000 increase which was revised up slightly. As a result claims remained [...]
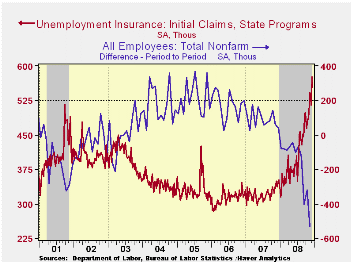
Last week, initial claims for unemployment insurance dipped by an expected 21,000. The decline to 554,000, however, reversed only a third of the prior week's 60,000 increase which was revised up slightly. As a result claims remained up by 85% from their lows of last year.Expectations had been for claims last week of 555,000 and the four-week moving average of initial claims rose again to this cycle's high of 543,750 (58.2% y/y).
The latest figure covers the survey week for December nonfarm payrolls and there was an 11,000 (2.0%) increase from the November period. Over the last ten years there has been an 81% inverse correlation between the level of initial claims and the month-to-month change in employment.
The Labor Department indicated that the largest increases in
initial claims for the week ending December 6 were in North Carolina
(+26,596), California (+22,963), Georgia (+20,237), Pennsylvania
(+20,090), and Tennessee (+12,170), while the largest decreases were in
Wisconsin (-8,593), Iowa (-3,424), North Dakota (-895), Arkansas
(-514), and Idaho (-320)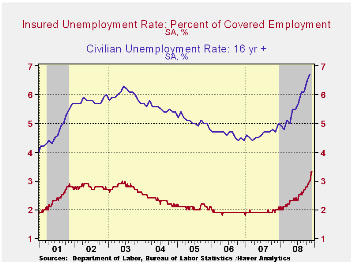
Continuing claims for unemployment insurance during the week of December 6 fell 47,000 after an upwardly revised (slightly) 340,000 during the prior week. The latest was the highest level since 1982. The four-week average of continuing claims rose to 4,226,000. Continuing claims provide some indication of workers' ability to find employment and they lag the initial claims figures by one week.
The insured rate of unemployment was stable w/w at this cycle's high of 3.3%. The highest insured unemployment rates in the week ending November 29 were in Oregon (5.6 percent), Alaska (5.3), Puerto Rico (5.2), Michigan (5.0), Wisconsin (4.8), Idaho (4.7), South Carolina (4.6), California (4.5), Nevada (4.5), Arkansas (4.4), and Pennsylvania (4.4).
Financial Crisis Casts Shadow Over Commercial Real Estate from the Federal Reserve Bank of Dallas can be found here.
| Unemployment Insurance (000s) | 12/13/08 | 12/06/08 | 11/29/08 | Y/Y | 2007 | 2006 | 2005 |
|---|---|---|---|---|---|---|---|
| Initial Claims | 554 | 575 | 515 | 58.7% | 322 | 313 | 331 |
| Continuing Claims | -- | 4,384 | 4,431 | 65.6% | 2,552 | 2,459 | 2,662 |
by Tom Moeller December 18, 2008
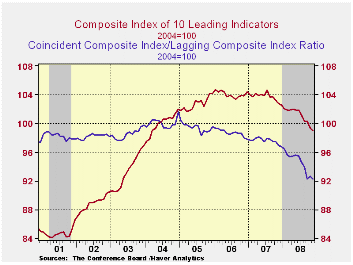
The Conference Board indicated that it's composite index of leading economic indicators fell during November by 0.4% after a slightly revised 0.9% October decline. The peak for the index was in July of last year and the six-month percent change fell to -5.6%, the largest rate of decline since 1990.
Six of the ten components of the leading index fell last month
with the largest decline coming from building permits which alone
subtracted 0.5% from the leading index. Higher initial claims for
jobless insurance in addition subtracted 0.3% and lower stock prices
subtracted 0.4%. Also down were weekly hours, vendor performance, and
consumer expectations. A steeper yield curve and faster money supply
growth together added back 1.0% to the index level.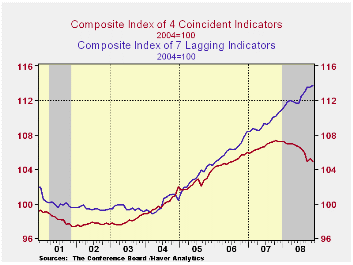
The breadth of one-month increase amongst the leaders' 10 components improved slightly to 40% but over a six-month period the breadth of gain amongst the components remained quite low at 30%.
The leading index is based on actual reports for eight economic data series. The Conference Board initially estimates two series, orders for consumer goods and orders for capital goods.
The coincident indicators reversed the prior month's gain and fell 0.3%. Three quarters of the index components fell m/m but over six months 12.5% rose. Over the last ten years there has been an 86% correlation between the y/y changes in the coincident indicators and real GDP.
The lagging index ticked up 0.1% after no change in October. The ratio of coincident-to-lagging indicators (a measure of economic excess) fell back to its lowest level since 1975.
Visit the Conference Board's site for coverage of leading indicator series from around the world.
| Business Cycle Indicators (%) | November | October | September | August 6-Month % (AR) | 2007 | 2006 | 2005 |
|---|---|---|---|---|---|---|---|
| Leading | -0.4 | -0.9 | 0.0 | -5.6 | -0.4 | 1.3 | 2.7 |
| Coincident | -0.3 | 0.3 | -1.0 | -3.5 | 1.7 | 2.4 | 2.5 |
| Lagging | 0.1 | 0.0 | 0.6 | 3.6 | 2.9 | 3.1 | 3.1 |
by Tom Moeller December 18, 2008
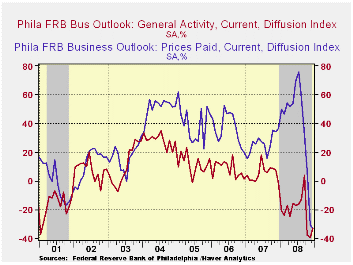
The Philadelphia Federal Reserve Bank indicated, with its December Business Activity Index, a level of U.S. economic weakness that rivals the lows of the series' forty year history. The bank reported that its December Index of General Business conditions in the manufacturing sector did improve slightly from November to -32.9 from this cycle's November low of -39.2, but the latest was still near the lowest level since the recession of 1990. It also wasn't far above the lows of earlier recessions. A reading of -40 had been expected for this month.
During the last ten years there has been a 61% correlation between the level of the Philadelphia Fed Business Conditions Index and the three-month growth in factory sector industrial production. There has been a 43% correlation with q/q growth in real GDP.
The Philadelphia Fed constructs a diffusion index for total business activity and each of the sub-indexes. The business conditions index reflects a separate survey question.
Amongst the sub-indexes, the new orders index improved the
most m/m to its highest level since September. However, it remained
quite negative and near the lowest level since the recession of 1990.
The shipments index deteriorated to a new cycle low. 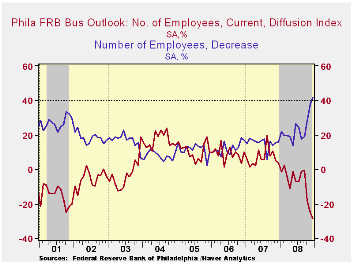
The employment index fell another 3.5 points to a new cycle low and that was the lowest level since the recession year of 1982. Forty two percent of respondents expected to reduce employment levels, the highest since 1981, while only 12.9% expected to raise them. During the last ten years there has been a 79% correlation between the index level and the m/m change in manufacturing sector payrolls.
The prices paid index fell to another record low of -33.2. During the last ten years there has been a 67% correlation between the prices paid index and the three-month growth in the intermediate goods PPI. There has been an 82% correlation with the change in core intermediate goods prices.
The separate index of expected business conditions in six months also fell to near its lowest level since 2001. The expectations index for new orders fell further to a new cycle low. The expectations index for employment fell to a new record low while the expected prices paid figure fell further to a new record low.
The latest Business Outlook Survey from the Federal Reserve Bank of Philadelphia can be found here.
| Philadelphia Fed (%) | December | November | December '07 | 2008 | 2007 | 2006 |
|---|---|---|---|---|---|---|
| General Activity Index | -32.9 | -39.3 | -1.6 | -21.2 | 5.1 | 8.1 |
| Prices Paid Index | -33.2 | -30.7 | 36.5 | 36.1 | 26.4 | 36.6 |
by Robert Brusca December 18, 2008
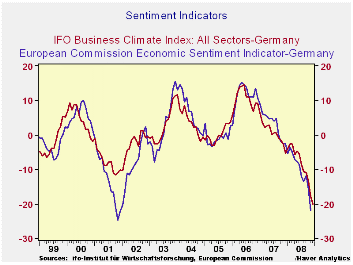
TThe IFO index fell to 82.6 in December from 85.8 in November.
The current situation index fell to 88.8 in Dec. from 94.9 in Nov.
Business expectations decreased to 76.8 from 77.6. The IFO index is
much weaker in 2008 than it was in 2001. But the EU sentiment index is
only about as week in 2008 as it was in 2001.
The all –sector reading of the IFO is weaker than any
individual sector in terms of its position in its range. That result is
a testament to how this crisis is leaving no sector untouched.
Construction is the best relative performing sector as it stands in the
39th percentile of its range. This is mostly because construction has
remained weak in recovery. The next strongest sector is wholesaling at
a -21.8 net reading. At that it stands in the bottom quarter of its
range. The service sector, the most stable of them all, registers a raw
net reading of -7.3 but that resides in the bottom 18 percentile of its
range. Retailing and MFG are in, roughly, the bottom 10 percent of
their respective ranges, since early 1991.
The IFO is showing great weakness and the detailed readings
(not yet available) for December have been showing more weakness in the
important export sector. The IMF is urging Germany to do more to
stimulate its economy. The German economics ministry is cutting its own
outlook for growth. It said: "The outlook for the economic development
has deteriorated further. The weakening of the world economy will be
stronger than previously assumed. At the same time, the situation on
international financial markets is still severely strained," the German
economics ministry continued in its December monthly report to discuss
the outlook. "The outlook for the export-driven German economy is
gloomier." It said economic indicators are signaling that that the
contraction of real gross domestic product, which was down 0.5% in the
third quarter, has probably continued at a faster pace and there is no
sign of any change in the weakening trend.” This of course is exactly
the message from the day’s IFO report, too.
| Summary of IFO Sector Diffusion readings: CLIMATE | ||||||||
|---|---|---|---|---|---|---|---|---|
| CLIMATE Sum | Current | Last Mo | Since Jan 1991* | |||||
| Nov-08 | Oct-08 | average | Median | Max | Min | range | % range | |
| All Sectors | -29.0 | -20.2 | -7.7 | -8.4 | 16.9 | -30.9 | 47.8 | 4.0% |
| MFG | -29.6 | -18.9 | -0.2 | 1.6 | 27.0 | -35.9 | 62.9 | 10.0% |
| Construction | -30.2 | -27.7 | -28.2 | -30.3 | 1.3 | -50.5 | 51.8 | 39.2% |
| Wholesale | -21.8 | -15.1 | -13.2 | -15.7 | 23.6 | -39.3 | 62.9 | 27.8% |
| Retail | -33.5 | -25.1 | -14.2 | -14.5 | 28.7 | -39.7 | 68.4 | 9.1% |
| Services | -7.3 | -4.3 | 11.0 | 9.5 | 28.5 | -15.2 | 43.7 | 18.1% |
| * June 2001 for Services | ||||||||

Tom Moeller
AuthorMore in Author Profile »Prior to joining Haver Analytics in 2000, Mr. Moeller worked as the Economist at Chancellor Capital Management from 1985 to 1999. There, he developed comprehensive economic forecasts and interpreted economic data for equity and fixed income portfolio managers. Also at Chancellor, Mr. Moeller worked as an equity analyst and was responsible for researching and rating companies in the economically sensitive automobile and housing industries for investment in Chancellor’s equity portfolio. Prior to joining Chancellor, Mr. Moeller was an Economist at Citibank from 1979 to 1984. He also analyzed pricing behavior in the metals industry for the Council on Wage and Price Stability in Washington, D.C. In 1999, Mr. Moeller received the award for most accurate forecast from the Forecasters' Club of New York. From 1990 to 1992 he was President of the New York Association for Business Economists. Mr. Moeller earned an M.B.A. in Finance from Fordham University, where he graduated in 1987. He holds a Bachelor of Arts in Economics from George Washington University.
More Economy in Brief


