 Global| Jan 08 2009
U.S. Weekly Claims For JoblessInsurance Fell Further
by:Tom Moeller
|in:Economy in Brief
Summary
Last week, initial claims for unemployment insurance fell again. The 24,000 week-to-week decline to 467,000 followed a revised decline of 98,000 during Christmas week. The latter decline was widely attributed to an aberrant seasonal [...]
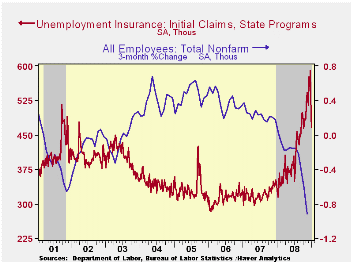
Last week, initial claims for unemployment insurance fell again. The 24,000 week-to-week decline to 467,000 followed a revised decline of 98,000 during Christmas week. The latter decline was widely attributed to an aberrant seasonal factor, although a problem near this magnitude has not been observed since 2001. Consensus expectations had been for a snapback last week to 540,000. The latest weekly figure may also have been influenced by the difficulty of seasonal adjustment, due to New Year's.
The latest figure was the lowest since the week ending October 11, when initial claims were at 463,000. The four-week moving average of initial claims fell from the cycle's high to 525,750 (53.4% y/y).
The Labor Department indicated that the largest increases in
initial claims for the week ending Dec. 27 were in Wisconsin (+16,081),
Michigan (+10,524), Kansas (+10,485), Massachusetts (+10,265), and New
Jersey (+7,330), while the largest decreases were in Texas (-13,232),
California (-9,702), Florida (-8,566), Virginia (-5,943), and South
Carolina (-4,678).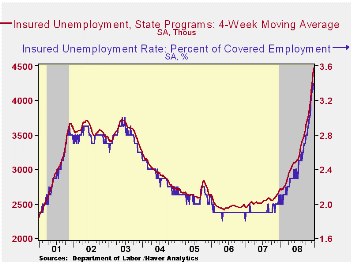
Continuing claims for unemployment insurance during the week of December 27 surged 101,000 following the 138,000 jump during the prior week. The latest was the highest level since 1982. The four-week average of continuing claims rose 45,000 to 4,470,000. Continuing claims provide some indication of workers' ability to find employment and they lag the initial claims figures by one week.
The insured rate of unemployment remained for the second week at this cycle's high of 3.4%. The highest insured unemployment rates in the week ending December 20 were in Oregon (6.1 percent), Idaho (5.3), Michigan (5.2), Nevada (5.1), Puerto Rico (5.0), Pennsylvania (4.7), Wisconsin (4.7), South Carolina (4.4), Arkansas (4.3), Indiana (4.2), New Jersey (4.2), and Washington (4.2).
Financial Crisis Casts Shadow Over Commercial Real Estate from the Federal Reserve Bank of Dallas is available here.
Agricultural Markets and Food Price Inflation—A conference summary from the Federal Reserve Bank of Chicago can be found here.
| Unemployment Insurance (000s) | 01/03/09 | 12/27/08 | 12/20/08 | Y/Y | 2008 | 2007 | 2006 |
|---|---|---|---|---|---|---|---|
| Initial Claims | 467 | 491 | 589 | 41.5% | 420 | 321 | 313 |
| Continuing Claims | -- | 4,611 | 4,510 | 65.6% | 3,342 | 2,552 | 2,459 |
Credit Cards Pocketed; The Frugal U.S. Consumer
by Tom Moeller January 8, 2009
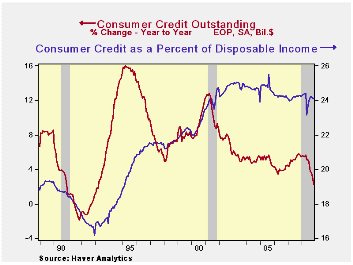
U.S. consumer credit usage dropped during November for the third month in the last four. The Federal Reserve reported that consumer credit outstanding fell $8.0 billion m/m after a $2.8B October decline that was slightly shallower than reported initially. On a percentage basis, credit outstanding over the last three months fell at a 0.6% annual rate which was the largest decline since 1992.
Annualized, credit growth averaged 8% during the fifteen years ended 2007. Over an even longer period that increase does not loom particularly large. However, against an average 5% growth in disposable income during those years, it precipitated a rise in the ratio to disposable income to 24% from a longer term norm of 17%. The credit cards are now being put away, certainly with the weakness in the labor market.
Non-revolving credit, which accounts for nearly two-thirds of
total consumer credit, dropped sharply for the third month in the last
four. The whopping $5.2B m/m drop was near the largest on record and it
reduced annualized growth during the last three months to -0.9%, the
weakest since 1992. That followed a 4.4% rise last year.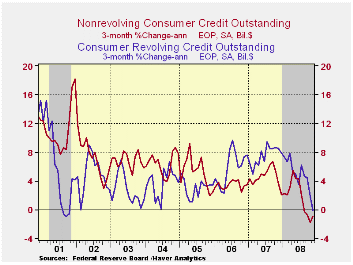
Revolving credit outstanding fell $2.8B during November. This dropped the three-month growth in credit card usage to -0.1%. That was down from the 7.4% growth last year and it was the weakest since the recession year of 2001.
These figures are the major input to the Fed's quarterly Flow
of Funds accounts for the household sector. For 4Q08 the data will be
released later this month.
These data are available in Haver's USECON database.
The Budget and Economic Outlook: Fiscal Years 2009 to 2019 from the Congressional Budget Office can be found here.
| Consumer Credit (m/m Chg, SAAR) | November | October | Y/Y | 2007 | 2006 | 2005 |
|---|---|---|---|---|---|---|
| Total | $-8.0B | $-2.8B | 2.3% | 5.5% | 4.5% | 4.3% |
| Revolving | $-2.8B | $0.0B | 4.0% | 7.4% | 6.1% | 3.1% |
| Non-revolving | $-5.2B | $-2.8B | 1.2% | 4.4% | 3.6% | 4.9% |
by Robert Brusca January 8, 2009
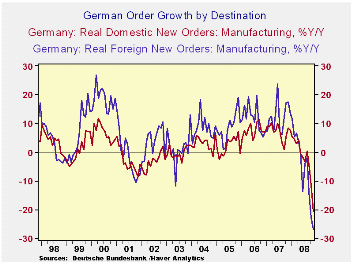
German orders are plunging dropping by 6% in November, 6.3% in
October and by 8.3% in October. That is quite a string of losing
numbers. Order are falling at about a 50% annual rate in the fourth
quarter an that is true of orders both domestic and foreign sourced as
well.
Sales have been weak in Germany in the quarter as well as
consumer durables sales are dropping at a 23% annual rate. Car sales
are weak globally. But even capital goods sales are dropping at a 15%
annual rate in Q4 and sales of intermediate goods are down at a 23%
annual rate, all in real terms.
German orders are now so weak that the are off by 24% Yr/Yr.
It’s real pain.
| German Orders and Sales By Sector and Origin | ||||||||
|---|---|---|---|---|---|---|---|---|
| Real and SA | % M/M | % Saar | ||||||
| Nov-08 | Oct-08 | Sep-08 | 3-MO | 6-Mo | 12-Mo | YrAgo | QTR-2-Date | |
| Total Orders | -6.0% | -6.3% | -8.3% | -57.6% | -34.9% | -24.0% | 13.0% | -49.7% |
| Foreign Orders | -4.4% | -6.3% | -11.6% | -60.8% | -37.4% | -26.9% | 17.4% | -53.0% |
| Domestic Orders | -7.6% | -6.4% | -4.7% | -53.8% | -32.1% | -20.7% | 8.4% | -45.9% |
| Real Sector Sales | ||||||||
| MFG/Mining | -4.5% | -0.1% | -4.3% | -30.4% | -16.6% | -7.0% | 4.3% | -16.8% |
| Consumer | -2.2% | -0.1% | -1.2% | -13.0% | -6.7% | -5.3% | 1.2% | -6.1% |
| Consumer Durables | -4.5% | -1.1% | -6.2% | -38.1% | -21.3% | -9.7% | -0.5% | -22.9% |
| Consumer Nondurables | -1.7% | 0.1% | -0.2% | -7.1% | -3.6% | -4.5% | 1.5% | -2.5% |
| Capital Goods | -5.2% | 1.0% | -5.4% | -32.6% | -17.9% | -6.6% | 5.8% | -15.5% |
| Intermediate Goods | -5.0% | -1.3% | -4.5% | -35.8% | -19.9% | -8.7% | 4.5% | -23.6% |
| All MFG-Sales | -4.2% | 0.0% | -4.2% | -29.1% | -15.8% | -6.6% | 3.7% | -15.8% |
EMU is on an All-time Low for Sentiment Manufacturing and Services Plunge
by Robert Brusca January 8, 2009
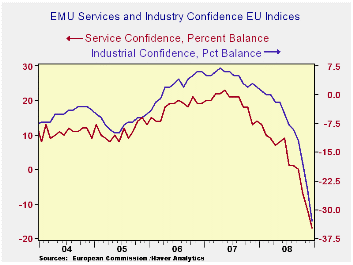
The table above summaries the overall EU and sector sentiment
gauges. In the bottom panel the EMU and country indices are presented.
The blue percentile panel presents the raw readings as a percentage in
their all range of values. Overall EU and EMU sentiment are on all time
lows: the zero percentile. Most large EU countries are on their worst
ever reading as well – or close to it (France).
The percentage drops in the sentiment reading across countries
are still huge; for EMU as a single entity the drop is 10% in December.
In addition all major sectors are their lows (since 1990) for
the EU. We plot the MFG sector and service sector indices above. Their
paths tell a clear story of how weak things are and that the path lower
still appears to have further downside. There is no deceleration in the
drop or any sense of a bounce.
| EU Sectors and Country level Overall Sentiment | |||||||||||
|---|---|---|---|---|---|---|---|---|---|---|---|
| EU | Dec 08 |
Nov 08 |
Oct 08 |
Sep 08 |
%tile | Rank | Max | Min | Range | Mean | R-SQ w/Overall |
| Overall | 63.5 | 70.5 | 77.2 | 84.9 | 0.0 | 220 | 116 | 64 | 53 | 99 | 1.00 |
| Industrial | -32 | -25 | -19 | -13 | 0.0 | 220 | 7 | -32 | 39 | -7 | 0.87 |
| Consumer Confid | -28 | -24 | -23 | -19 | 0.0 | 220 | 2 | -28 | 30 | -11 | 0.84 |
| Retail | -24 | -18 | -16 | -13 | 0.0 | 220 | 6 | -24 | 30 | -6 | 0.55 |
| Construction | -32 | -29 | -25 | -20 | 22.2 | 185 | 3 | -42 | 45 | -17 | 0.41 |
| Services | -23 | -18 | -10 | -4 | 0.0 | 145 | 32 | -23 | 55 | 16 | 0.84 |
| % m/m | Dec 08 |
Based on Level | Level | ||||||||
| EMU | -10.4% | -6.4% | -8.6% | 67.1 | 0.0 | 220 | 117 | 67 | 50 | 99 | 0.95 |
| Germany | -6.4% | -7.1% | -5.1% | 77.0 | 0.0 | 220 | 121 | 77 | 44 | 99 | 0.64 |
| France | -9.8% | -1.6% | -8.6% | 75.4 | 7.9 | 218 | 119 | 72 | 47 | 99 | 0.79 |
| Italy | -12.2% | -1.5% | -6.9% | 71.0 | 0.0 | 220 | 121 | 71 | 50 | 99 | 0.79 |
| Spain | -10.0% | -4.2% | -5.0% | 57.0 | 0.0 | 220 | 118 | 57 | 61 | 99 | 0.65 |
| Memo: UK | -1.0% | -12.5% | -7.5% | 61.0 | 0.0 | 220 | 118 | 61 | 57 | 99 | 0.48 |
| Since 1990 except Services (Oct 1996) 247 | -Count | Services: | 145 | -Count | |||||||
| Sentiment is an index, sector readings are net balance diffusion measures | |||||||||||

Tom Moeller
AuthorMore in Author Profile »Prior to joining Haver Analytics in 2000, Mr. Moeller worked as the Economist at Chancellor Capital Management from 1985 to 1999. There, he developed comprehensive economic forecasts and interpreted economic data for equity and fixed income portfolio managers. Also at Chancellor, Mr. Moeller worked as an equity analyst and was responsible for researching and rating companies in the economically sensitive automobile and housing industries for investment in Chancellor’s equity portfolio. Prior to joining Chancellor, Mr. Moeller was an Economist at Citibank from 1979 to 1984. He also analyzed pricing behavior in the metals industry for the Council on Wage and Price Stability in Washington, D.C. In 1999, Mr. Moeller received the award for most accurate forecast from the Forecasters' Club of New York. From 1990 to 1992 he was President of the New York Association for Business Economists. Mr. Moeller earned an M.B.A. in Finance from Fordham University, where he graduated in 1987. He holds a Bachelor of Arts in Economics from George Washington University.
More Economy in Brief


