 Global| Jan 08 2009
U.S. Weekly Claims For Jobless Insurance Fell Further
by:Tom Moeller
|in:Economy in Brief
Summary
Last week, initial claims for unemployment insurance fell again. The 24,000 week-to-week decline to 467,000 followed a revised decline of 98,000 during Christmas week. The latter decline was widely attributed to an aberrant seasonal [...]
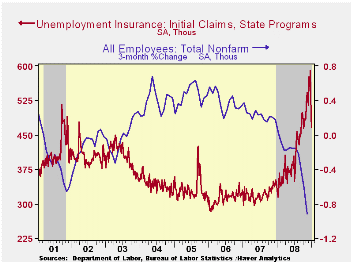
Last week, initial claims for unemployment insurance fell again. The 24,000 week-to-week decline to 467,000 followed a revised decline of 98,000 during Christmas week. The latter decline was widely attributed to an aberrant seasonal factor, although a problem near this magnitude has not been observed since 2001. Consensus expectations had been for a snapback last week to 540,000. The latest weekly figure may also have been influenced by the difficulty of seasonal adjustment, due to New Year's.
The latest figure was the lowest since the week ending October 11, when initial claims were at 463,000. The four-week moving average of initial claims fell from the cycle's high to 525,750 (53.4% y/y).
The Labor Department indicated that the largest increases in initial claims for the week ending Dec. 27 were in Wisconsin (+16,081), Michigan (+10,524), Kansas (+10,485), Massachusetts (+10,265), and New Jersey (+7,330), while the largest decreases were in Texas (-13,232), California (-9,702), Florida (-8,566), Virginia (-5,943), and South Carolina (-4,678).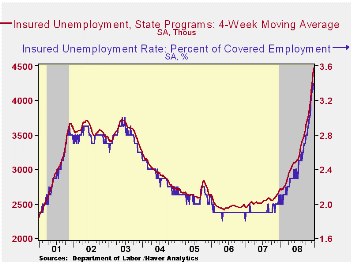
Continuing claims for unemployment insurance during the week of December 27 surged 101,000 following the 138,000 jump during the prior week. The latest was the highest level since 1982. The four-week average of continuing claims rose 45,000 to 4,470,000. Continuing claims provide some indication of workers' ability to find employment and they lag the initial claims figures by one week.
The insured rate of unemployment remained for the second week at this cycle's high of 3.4%. The highest insured unemployment rates in the week ending December 20 were in Oregon (6.1 percent), Idaho (5.3), Michigan (5.2), Nevada (5.1), Puerto Rico (5.0), Pennsylvania (4.7), Wisconsin (4.7), South Carolina (4.4), Arkansas (4.3), Indiana (4.2), New Jersey (4.2), and Washington (4.2).
Financial Crisis Casts Shadow Over Commercial Real Estate from the Federal Reserve Bank of Dallas is available here.
Agricultural Markets and Food Price Inflation—A conference summary from the Federal Reserve Bank of Chicago can be found here.
| Unemployment Insurance (000s) | 01/03/09 | 12/27/08 | 12/20/08 | Y/Y | 2008 | 2007 | 2006 |
|---|---|---|---|---|---|---|---|
| Initial Claims | 467 | 491 | 589 | 41.5% | 420 | 321 | 313 |
| Continuing Claims | -- | 4,611 | 4,510 | 65.6% | 3,342 | 2,552 | 2,459 |

Tom Moeller
AuthorMore in Author Profile »Prior to joining Haver Analytics in 2000, Mr. Moeller worked as the Economist at Chancellor Capital Management from 1985 to 1999. There, he developed comprehensive economic forecasts and interpreted economic data for equity and fixed income portfolio managers. Also at Chancellor, Mr. Moeller worked as an equity analyst and was responsible for researching and rating companies in the economically sensitive automobile and housing industries for investment in Chancellor’s equity portfolio. Prior to joining Chancellor, Mr. Moeller was an Economist at Citibank from 1979 to 1984. He also analyzed pricing behavior in the metals industry for the Council on Wage and Price Stability in Washington, D.C. In 1999, Mr. Moeller received the award for most accurate forecast from the Forecasters' Club of New York. From 1990 to 1992 he was President of the New York Association for Business Economists. Mr. Moeller earned an M.B.A. in Finance from Fordham University, where he graduated in 1987. He holds a Bachelor of Arts in Economics from George Washington University.
More Economy in Brief


