 Global| Jul 05 2007
U.S. Vehicle Sales Lowest Since 2005
by:Tom Moeller
|in:Economy in Brief
Summary
Last month, U.S. sales of light vehicles fell for the sixth consecutive month this year. The 3.4% m/m decline to an annualized selling rate of 15.6M units, according to the Autodata Corporation, was to the lowest level since October [...]
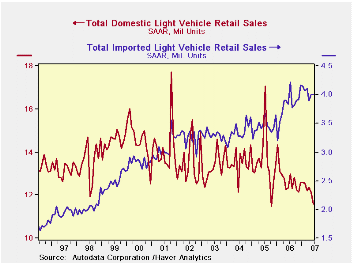
Last month, U.S. sales of light vehicles fell for the sixth consecutive month this year. The 3.4% m/m decline to an annualized selling rate of 15.6M units, according to the Autodata Corporation, was to the lowest level since October 2005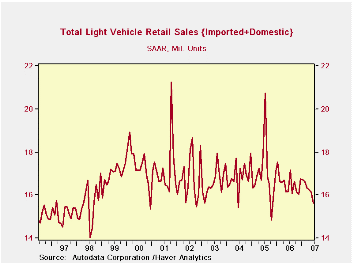
Sales of imported vehicles held about steady m/m, due to sharp discounting, at a 4.00M selling rate (4.4% y/y). Sales of imported cars ticked up by 0.9% y/y but sales of imported light trucks surged 11.4% y/y.
Domestic car sales fell a hard 5.0%m/m (-2.1% y/y) after a 9.2% jump during May. Sales of domestic light trucks also fell a sharp 4.2% m/m (-8.9% y/y during June after an 8.9% drop the prior month.
| Light Vehicle Sales (SAAR, Mil. Units) | June | May | Y/Y | 2006 | 2005 | 2004 |
|---|---|---|---|---|---|---|
| Total | 15.60 | 16.16 | -3.5% | 16.55 | 16.96 | 16.87 |
| Autos | 7.63 | 7.96 | -1.1% | 7.77 | 7.65 | 7.49 |
| Trucks | 7.97 | 8.20 | -5.8% | 8.78 | 9.32 | 9.37 |
by Tom Moeller July 5, 2007
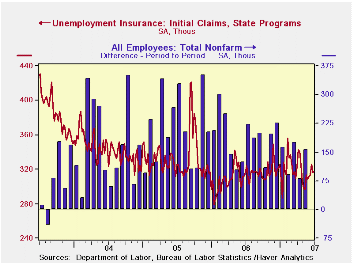
Initial unemployment insurance claims rose 2,000 to 318,000last week after a 10,000 increase the week prior.
During the last ten years there has been a (negative) 77% correlation between the level of initial claims and the m/m change in nonfarm payroll employment.
The four-week moving average of initial claims rose to 318,500 (2.8% y/y).
An 84,000 rise in continuing claims for unemployment insurance reversed all of a 32,000 decline during the week prior.The insured rate of unemployment ticked up to 2.0%.
| Unemployment Insurance (000s) | 06/30/07 | 06/27 /07 | Y/Y | 2006 | 2005 | 2004 |
|---|---|---|---|---|---|---|
| Initial Claims | 318 | 316 | 0.6% | 313 | 332 | 343 |
| Continuing Claims | -- | 2,569 | 4.7% | 2,459 | 2,662 | 2,924 |
by Tom Moeller July 5, 2007
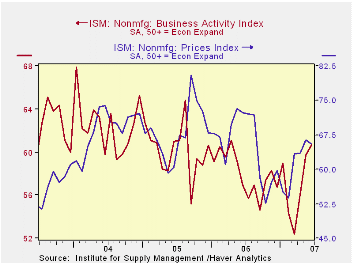
The non-manufacturing sector Business Activity Index for June rose to 60.7, up a point m/m, and the gain was to the highest level since April 2006 according to the Institute for Supply Management.
Since the series' inception in 1997 there has been a 46% correlation between the level of the Business Activity Index and the Q/Q change in real GDP for services plus construction.
The employment sub index ticked up to 55.0, its highest level in more than year. Since the series' inception in 1997 there has been a 56% correlation between the level of the ISM non-manufacturing employment index and the m/m change in payroll employment in the service producing plus the construction industries.
The new orders index in contrast, fell m/m to 56.9, a level which still indicates growth in new orders.
Pricing power fell a modest 0.9 points to 65.5 after a sharp 2.9 point rise during May. Since inception eight years ago, there has been a 70% correlation between the price index and the y/y change in the GDP services chain price index.
ISM surveys more than 370 purchasing managers in more than 62 industries including construction, law firms, hospitals, government and retailers. The non-manufacturing survey dates back to July 1997.Business Activity Index for the non-manufacturing sector reflects a question separate from the subgroups mentioned above. In contrast, the NAPM manufacturing sector composite index is a weighted average five components.
The Role of Small Businesses in Economic Development from the Federal Reserve Bank of Kansas City can be found here.
| ISM Nonmanufacturing Survey | June | May | June '06 | 2006 | 2005 | 2004 |
|---|---|---|---|---|---|---|
| Business Activity Index | 60.7 | 59.7 | 56.9 | 58.0 | 60.2 | 62.5 |
| Prices Index | 65.5 | 66.4 | 72.3 | 65.2 | 68.0 | 68.8 |
by Robert Brusca July 5, 2007
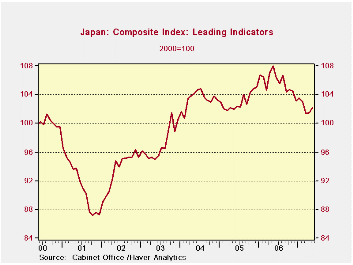
Japan’s May rise in its LEI is the second in a two months technically, but is still not very impressive. Most growth rates still show it declining (see chart and table). However, over two years the index does post an annualized rate of growth of +0.2%. Japan’s economy has been vexing in this cycle.
After a period of weakness Japan posted a rise in its LEI and of course in the underlying conditions that this index represents. The LEI’s growth rate from October 2001 to July of 2004 was at an annual rate of 7.1%, pretty impressive. But then it peaked dipped and expanded again. The next result was that from the peak to next peak from roughly July 2004 – May 2006 the growth of the index dropped off to a pace of 2.6%. Then really bad things began to happen as from that second peak in May 2006 the index fell to a low in March 2007 at 101.4 During that period the LEI was dropping at very fast 8.3% pace. Still the period of decline was less than a year. From the bottom of the LEI’s trough back in October of 2001 the LEI is still growing but at a much more modest pace of 2.9%.
While the two-month rebound in the LEI is not definitive or a reliable guide of the future it did arrest this extended period of decline the LEI.
During this period Japan has continued to be dogged by deflation and its growth statistics have continued to be irregular, as the LEI attests. But the BOJ has been making noise as though it nonetheless wanted to hike interest rates. While the LEI does not tell a comprehensive story on the economy it does tell a capsulated story and one that should be viewed as cautionary with respect to growth conditions in Japan.
Japan at one time turned the corner fast but then it slowed and has since backtracked. Weakness in the yen attests to the mixed situation there and how investors view it. While we do not like to see governments telling central banks the kind of policies they want it is understandable in this environment that Japan’s governing party is wary of the BoJ’s apparent intent to go back to a rate hiking cycle so soon.
The BOJ and the Japanese government are ever mindful of the demographics and fiscal difficulties that lie ahead for them. If anything these concerns have kept them too eager to restrict fiscal policy (by hiking taxes) and too quick to raise interest rates (or too slow to cut them). Japan remains a country with the opposite policy tendencies to most Western nations even if it faces many of the same problems.
| Levels | Growth (saar) | ||||||
| May-07 | Apr-07 | Mar-07 | 3M0 | 6M0 | 12Mo | 24MO | |
| LEI | 102.2 | 101.5 | 101.4 | -2.7% | -4.4% | -5.4% | 0.2% |

Tom Moeller
AuthorMore in Author Profile »Prior to joining Haver Analytics in 2000, Mr. Moeller worked as the Economist at Chancellor Capital Management from 1985 to 1999. There, he developed comprehensive economic forecasts and interpreted economic data for equity and fixed income portfolio managers. Also at Chancellor, Mr. Moeller worked as an equity analyst and was responsible for researching and rating companies in the economically sensitive automobile and housing industries for investment in Chancellor’s equity portfolio. Prior to joining Chancellor, Mr. Moeller was an Economist at Citibank from 1979 to 1984. He also analyzed pricing behavior in the metals industry for the Council on Wage and Price Stability in Washington, D.C. In 1999, Mr. Moeller received the award for most accurate forecast from the Forecasters' Club of New York. From 1990 to 1992 he was President of the New York Association for Business Economists. Mr. Moeller earned an M.B.A. in Finance from Fordham University, where he graduated in 1987. He holds a Bachelor of Arts in Economics from George Washington University.
More Economy in Brief


