 Global| Oct 03 2007
U.S. Vehicle Sales Flat; Truck Sales Down, Cars Up
by:Tom Moeller
|in:Economy in Brief
Summary
U.S. sales of light vehicles during September were roughly flat with August at a 16.23M unit annual selling rate. The September performance followed a 6.5% m/m rebound during August, according to the Autodata Corporation. Sales were [...]
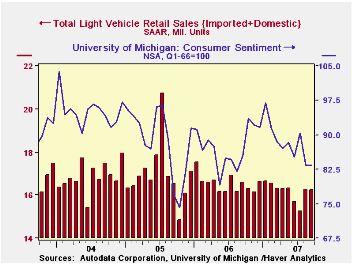
U.S. sales of light vehicles during September were roughly flat with August at a 16.23M unit annual selling rate. The September performance followed a 6.5% m/m rebound during August, according to the Autodata Corporation. Sales were better than expectations for a 5.9M selling rate.
Though gasoline prices have fallen somewhat since the May peak of $3.22 per gallon, the 21% gain last month versus September of 2006 appeared to impact those buyers searching for fuel efficiency.
Domestically made vehicle sales fell 1.5% m/m to 12.38M (-2.8% y/y). Sales of domestic light trucks fell 3.5% m/m to a 7.28M selling rate. In addition, for this year, sales of domestically assembled light trucks are down 3.1% versus the average of 2006 and sales last year fell 8.7% versus 2005.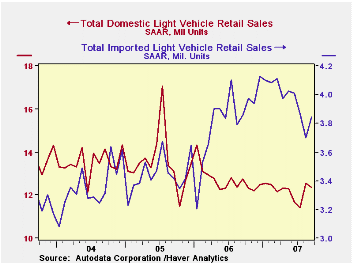
Conversely, sales of U.S. made cars rose 1.4% m/m to 5.10M units last month (-1.9% y/y) after a firm 6.2% August rise. The domestic auto business continued to be under pressure, however, as the selling rate so far this year is down 5.4% from 2006 and sales last year fell 1.7% y/y.
Sales of the relatively fuel efficient imported light vehicles posted a 4.1% m/m rise to 3.85M units (-0.3% y/y). Notable, however, was that gain was due to a 7.9% m/m gain in light truck sales which this year are up 7.5% from 2006, a year when sales of imported light trucks rose 14.2% from 2005.
Sales of imported cars rose 1.8% last month to 2.35M (-4.0% y/y) though the y/y decline is versus a very strong 2006 when sales rose 9.1% from 2005.
| Light Vehicle Sales (SAAR, Mil. Units) | September | August | Y/Y | 2006 | 2005 | 2004 |
|---|---|---|---|---|---|---|
| Total | 16.23 | 16.27 | -2.2% | 16.55 | 16.96 | 16.87 |
| Autos | 7.45 | 7.34 | -2.6% | 7.77 | 7.65 | 7.49 |
| Domestic | 5.10 | 5.03 | -1.9% | 5.31 | 5.40 | 5.36 |
| Imported | 2.35 | 2.31 | -4.0% | 2.45 | 2.25 | 2.14 |
| Trucks | 8.77 | 8.93 | -2.0% | 8.78 | 9.32 | 9.37 |
| Domestic | 7.28 | 7.54 | -3.5% | 7.42 | 8.12 | 8.15 |
| Imported | 1.50 | 1.39 | 6.3% | 1.37 | 1.20 | 1.23 |
by Tom Moeller October 3, 2007
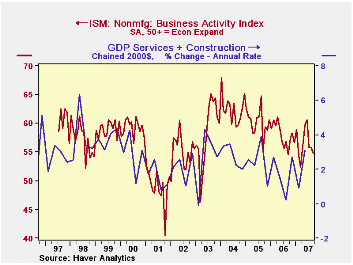
According to the Institute for Supply Management, the nonmanufacturing sector Business Activity Index for September dipped to 54.8 versus August which was unchanged from July. The dip was in line with Consensus expectations for a decline to 55.0.
Since the series' inception in 1997 there has been a 44% correlation between the level of the Business Activity Index and the Q/Q change in real GDP for services plus construction.
The new orders sub index provided much of the downward drift to the Business Activity Index and fell to 53.4 from 57.0 in August. The latest reading is near the lowest level since 2003.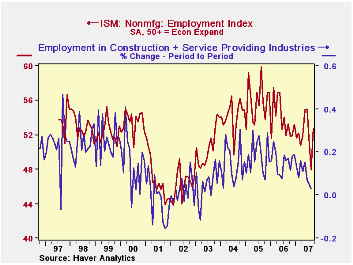
The employment sub index, however, recovered most of the declines during the prior two months with a rise to 52.7, back signaling positive jobs growth. Since the series' inception in 1997 there has been a 56% correlation between the level of the ISM nonmanufacturing employment index and the m/m change in payroll employment in the service producing plus the construction industries.
Pricing power improved and recovered most of the declines during the prior three months. Since inception ten years ago, there has been a 60% correlation between the price index and the q/q change in the GDP services chain price index.
ISM surveys more than 370 purchasing managers in more than 62 industries including construction, law firms, hospitals, government and retailers. The non-manufacturing survey dates back to July 1997.The Business Activity Index for the nonmanufacturing sector reflects a question separate from the subgroups mentioned above. In contrast, the NAPM manufacturing sector composite index is a weighted average of five components.
| ISM Nonmanufacturing Survey | September | August | September '06 | 2006 | 2005 | 2004 |
|---|---|---|---|---|---|---|
| Business Activity Index | 54.8 | 55.8 | 54.6 | 58.0 | 60.2 | 62.5 |
| Prices Index | 66.1 | 58.6 | 58.2 | 65.2 | 68.0 | 68.8 |
by Tom Moeller October 3, 2007
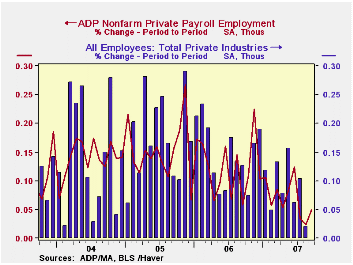
The U.S. Bureau of Labor Statistics employment figure for September will be published this Friday.
Last month, ADP's measure of private nonfarm payrolls for August indicated a revised 27,000 increase in jobs that was followed by a small 24,000 increase in private nonfarm payrolls.
The sub-index for large payrolls improved to a lesser rate of decline. Nevertheless, the index fell to its lowest level on record. The sub-index for small payrolls, conversely, rose an improved 53,000. According to ADP and Macro Advisers, the correlation between the monthly percentage change in the ADP estimate and that in the BLS data is 0.90. ADP compiled the estimate from its database of individual companies' payroll information. Macroeconomic Advisers, LLC, the St. Louis economic consulting firm, developed the methodology for transforming the raw data into an economic indicator. The ADP National Employment Report data is maintained in Haver's USECON database; historical data go back to December 2000. The figures in this report cover only private sector jobs and exclude employment in the public sector, which rose an average 11,083 during the last twelve months. The full ADP National Employment Report can be found here, and the ADP methodology is explained here.
| LAXEPA@USECON | September | August | Y/Y | 2006 | 2005 | 2004 |
|---|---|---|---|---|---|---|
| Nonfarm Private Payroll Employment (m/m Chg.) | 58,000 | 27,000 | 1.1% | 1.7% | 1.8% | 1.3% |
by Robert Brusca October 3, 2007
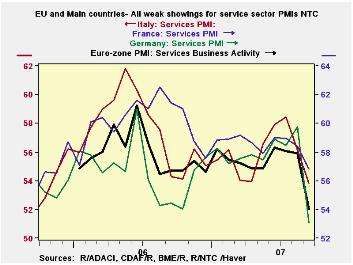
Service sector slows across EMU -- The Reuters/NTC EU indexes on the services sector show widespread weakness in September. For the Euro area 13, the index has dropped a sharp 3-plus points in September and the reading now resides only just above the midpoint of its range since May of 2000. In Germany, the reading holds in the 55th percentile of its range. For the other featured EMU countries the reading has dropped below the range midpoint. All readings remain above 50 and thus show continuing expansion in the sector. The UK index is relatively strong by comparison.
| NTC Services Indexes | ||||||
|---|---|---|---|---|---|---|
| Sep-07 | Aug-07 | 3Mo | 6Mo | 12Mo | Percentile | |
| Euro area 13 | 54.22 | 58.04 | 56.87 | 57.20 | 57.26 | 54.0% |
| Germany | 53.09 | 59.76 | 57.11 | 57.58 | 57.25 | 55.4% |
| France | 56.79 | 58.40 | 58.04 | 58.28 | 58.67 | 48.0% |
| Italy | 53.86 | 56.18 | 56.17 | 56.15 | 55.66 | 45.3% |
| Spain | 52.37 | 53.51 | 54.07 | 54.65 | 56.38 | 42.1% |
| Ireland | 54.76 | 56.98 | 55.98 | 56.31 | 58.46 | 41.9% |
| EU only | ||||||
| UK | 56.69 | 57.55 | 57.09 | 57.24 | 58.10 | 72.9% |
| Percentile is over range since May 2000 | ||||||
by Robert Brusca October 3, 2007
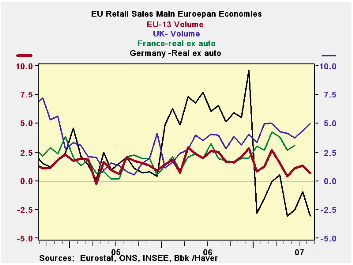
Retail volumes grew by just 0.1% in the Euro area 13 in August. This follows an upwardly-revised +0.4% in July. That is not an auspicious start to the quarter. However since Q2 ended on such a strong note, again of 0.6% that has sent Q3 off on a relatively firm note so that the gains so far in the quarter have been helped by that momentum. As a result, quarter-to-date growth in EMU is strong. Sales volumes overall are expanding at a 3% pace with food expenditures up at a pace of 0.6%; nonfood spending is expanding at a pace of 4% all annualized at the two-month market in the new quarter.
Still the individual country results are disparate. For Germany, sales are up at just a 2.1% pace in the quarter; for the UK the pace is a very hefty 8.1%. French figures are not yet available but France has been tracking on the high side. Still for EMU as a whole the pace of retail sales seems to be slowing. What the EMU post for the quarter will still depend importantly on what consumers do in September.
| Euro Area 13 Retail Sales Volume | ||||||
|---|---|---|---|---|---|---|
| Aug-07 | Jul-07 | Jun-07 | 3-Mo | 6-MO | 12-Mo | |
| Euro Area 13 Total | 0.1% | 0.4% | 0.6% | 4.5% | 1.9% | 0.7% |
| Food | 0.2% | 0.3% | -0.1% | 2.0% | 0.6% | 0.3% |
| Nonfood | -0.1% | 0.4% | 1.1% | 5.6% | 2.2% | 0.8% |
| Textiles | #N/A | 0.8% | 2.9% | 0.6% | 5.6% | 4.9% |
| HH Goods | #N/A | 0.2% | 1.4% | 4.9% | 3.3% | 3.7% |
| Books news, etc | #N/A | 0.2% | 1.6% | 3.9% | 3.4% | 3.3% |
| Pharmaceutical | #N/A | 0.3% | 0.2% | 3.8% | 3.7% | 3.3% |
| Other Nonspecified | #N/A | -0.1% | 1.3% | 2.2% | 3.4% | 1.1% |
| Mail order | #N/A | 0.9% | -0.1% | 9.3% | 9.5% | 1.6% |
| Nonfood Country Detail Volume | ||||||
| Germany | 0.9% | -0.5% | 3.0% | 14.5% | 2.1% | -2.7% |
| France | #N/A | 0.4% | 1.3% | 7.9% | 6.5% | 5.8% |
| Italy (Total; Value) | #N/A | -0.1% | 0.0% | -1.1% | -1.6% | -1.1% |
| UK (EU) | 0.7% | 0.7% | 1.0% | 10.2% | 7.5% | 7.0% |
| Shaded areas calculated on a one-month lag due to lagging data | ||||||
| The EA 13 countries are Austria, Belgium, Finland, France, Germany, Greece, Ireland, Italy, Luxembourg, the Netherlands, Portugal, Slovenia and Spain. | ||||||
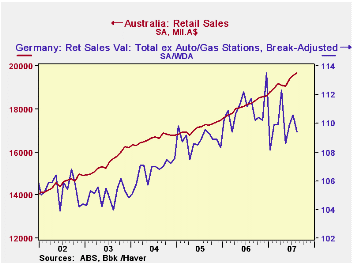
Retail sales in Australia extended their recent surge through a third month in August as they recovered from a dip in April-May. They were up 0.7% in August alone and 3.2% over the last three months, the strongest 3-month gain since late in 2003. At least one forecast survey looked for only half as much increase in August.
In a number of other countries, we have noted recently that consumer spending has been lagging. Germany is a prime example, with a 1.4% drop in August, and the entire Euro-Area saw a minuscule 0.7% rise in August. This does not seem to be the case in Australia. The country's economy is benefiting from the commodity boom and also is experiencing a growing surplus in its balance of trade in services. Further, it seems not to have been hit with a downturn in the housing market. Lending for home purchase looks fairly steady and significantly, prices of established homes are rising, especially in Melbourne, Brisbane and Adelaide. So the environment for consumer spending is favorable.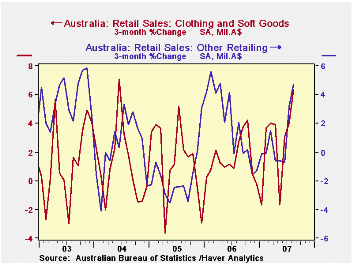
The upturn in reported retail sales in the last few months has occurred in several categories. All the reported categories were stronger in the June-August period than in the prior three months. But the biggest turns were in clothing, from a decline of 1.7% in February-May to a gain of 6.3% in the later span. The "other" retailing sector similarly went from a decrease of 0.6% to a gain of 4.7%. Household goods were basically flat from February through May, but then grew 3.1% from May through August.
So the retail sector in Australia is firm with a diversity of gains. One wire service said today (Wednesday in New York) that this would add to evidence that the Reserve Bank would want to raise rates soon. The mere expression of such sentiments at this time also sets the Australia economy and its policymakers apart from those in other parts of the world.
All of these data are included in Haver's ANZ database with some summary items in G10. Note that retail sales data in Australia do not include motor vehicles or motor fuel.
| Australia: Retail Sales, SA | Aug 2007* | July 2007* | Aug/- May | May/- Feb | Monthly Averages | ||
|---|---|---|---|---|---|---|---|
| 2006 | 2005 | 2004 | |||||
| Total, Mil.A$ | 19684 | 19542 | -- | -- | 18161 | 17144 | 16680 |
| Yr/Yr % Chg | 8.3 | 7.2 | -- | -- | 5.9 | 2.8 | 7.3 |
| Mo/Mo % Chg | 0.7 | 0.8 | 3.2 | 0.7 | -- | -- | -- |
| Food | 1.0 | 0.7 | 3.1 | 1.5 | 6.8 | 3.6 | 7.2 |
| Clothing/Soft Goods | -0.1 | 1.0 | 6.3 | -1.7 | 4.4 | 5.2 | 7.2 |
| Household Goods | 2.4 | -0.6 | 3.1 | 0.2 | 5.7 | 5.5 | 8.9 |
| "Other" Retailing | 1.5 | 1.5 | 4.7 | -0.6 | 5.9 | -4.1 | 5.9 |
| Hospitality | 1.2 | -0.6 | 2.1 | 0.8 | 8.3 | 2.6 | 7.7 |

Tom Moeller
AuthorMore in Author Profile »Prior to joining Haver Analytics in 2000, Mr. Moeller worked as the Economist at Chancellor Capital Management from 1985 to 1999. There, he developed comprehensive economic forecasts and interpreted economic data for equity and fixed income portfolio managers. Also at Chancellor, Mr. Moeller worked as an equity analyst and was responsible for researching and rating companies in the economically sensitive automobile and housing industries for investment in Chancellor’s equity portfolio. Prior to joining Chancellor, Mr. Moeller was an Economist at Citibank from 1979 to 1984. He also analyzed pricing behavior in the metals industry for the Council on Wage and Price Stability in Washington, D.C. In 1999, Mr. Moeller received the award for most accurate forecast from the Forecasters' Club of New York. From 1990 to 1992 he was President of the New York Association for Business Economists. Mr. Moeller earned an M.B.A. in Finance from Fordham University, where he graduated in 1987. He holds a Bachelor of Arts in Economics from George Washington University.
More Economy in Brief


