 Global| Jul 20 2009
U.S. Unemployment Rates RiseSharply And Rapidly For All
by:Tom Moeller
|in:Economy in Brief
Summary
The current recession has been harshest in the labor market. Employers look to cut costs as top-line revenues falter. Though the June unemployment rate of 9.5% was below the 1981-82 peak of 10.8%, the speed of the rate's recent [...]
The current recession has been harshest in the labor market. Employers look to cut costs as top-line revenues falter. Though the June unemployment rate of 9.5% was below the 1981-82 peak of 10.8%, the speed of the rate's recent increase has been notably swift. Today the rate is up 3.9 percentage points from one year ago. That matches the record increase for twelve months set during the 1973-75 recession when the unemployment rate reached its peak of 9.0%. The recent increase is against a 3.8% decline in employment during the last twelve months and by 4.4% since the recession began in late-2007.
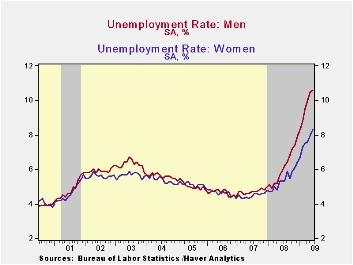
It's not bad enough that the overall rate of unemployment has risen so quickly to its current level, but the experience of specific groups has been most severe. The unemployment rate for men over the last year has risen a record 4.7 percentage points to a near-record 10.6%. For teenage men, the 12-month increase to an unemployment rate of 26.2% lags the record increase only slightly while the increase in the adult male unemployment rate to 9.2% sets a new record, up 4.7 percentage points y/y. The pain for women has been every bit as great. The 3.0 point, twelve-month increase to an unemployment rate of 8.3% about matches the record pace. For teenage women, the speed of the rate's increase to 21.8% also is near the record. Finally, the adult women unemployment rate is up nearly three points to 7.0%, also near the record twelve-month increase reached back in 1975.
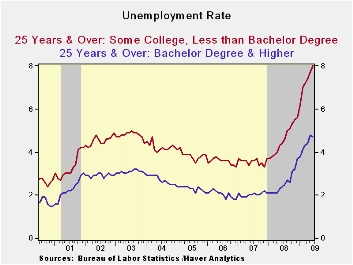
 Schooling matters when it comes to employability, and the
Labor Department measures individuals' level of education. For those
with a college degree, the labor market has indeed weakened, but not as
significantly as the overall figures have. For these individuals
employment has declined 1.2% during the last year compared to 3.7%
growth as recently as 2007. That weakening has doubled the unemployment
rate, but only to 4.7%. For those with less than a high school diploma,
the story is different and more dire. The unemployment rate more than
doubled to 15.5% as employment fell 6.0% y/y. For high school graduates
without college the unemployment rate also doubled to 15.5%. For those
with at least some college the unemployment rate rate rose but to a
lesser 8.0%. Back to school and back to work: community
colleges and workforce development is a recent article from
the Federal Reserve Bank of San Francisco and it is available
here.
Schooling matters when it comes to employability, and the
Labor Department measures individuals' level of education. For those
with a college degree, the labor market has indeed weakened, but not as
significantly as the overall figures have. For these individuals
employment has declined 1.2% during the last year compared to 3.7%
growth as recently as 2007. That weakening has doubled the unemployment
rate, but only to 4.7%. For those with less than a high school diploma,
the story is different and more dire. The unemployment rate more than
doubled to 15.5% as employment fell 6.0% y/y. For high school graduates
without college the unemployment rate also doubled to 15.5%. For those
with at least some college the unemployment rate rate rose but to a
lesser 8.0%. Back to school and back to work: community
colleges and workforce development is a recent article from
the Federal Reserve Bank of San Francisco and it is available
here.
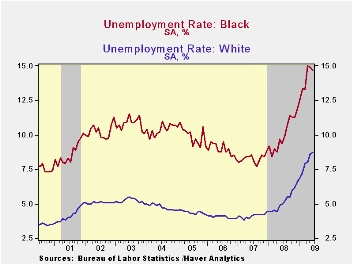
 The job market figures also indicate great divergence by race
and age. The white teenager unemployment rate jumped sharply last month
to 21.4% from 16.7% for all of last year. Black teens also experienced
joblessness, but at much higher level. Their level of unemployment
touched 37.9% last month and employment over the last year fell 14.2%
versus a lesser 10.7% decline amongst white teens. For adult whites,
unemployment doubled to a below average 8.1% as employment fell 3.2%
y/y while blacks' unemployment rose to 13.7%. Monetary policy
and racial unemployment rates is a 2000
article from the Federal Reserve Bank of Atlanta and it can be found
here.
The job market figures also indicate great divergence by race
and age. The white teenager unemployment rate jumped sharply last month
to 21.4% from 16.7% for all of last year. Black teens also experienced
joblessness, but at much higher level. Their level of unemployment
touched 37.9% last month and employment over the last year fell 14.2%
versus a lesser 10.7% decline amongst white teens. For adult whites,
unemployment doubled to a below average 8.1% as employment fell 3.2%
y/y while blacks' unemployment rose to 13.7%. Monetary policy
and racial unemployment rates is a 2000
article from the Federal Reserve Bank of Atlanta and it can be found
here.
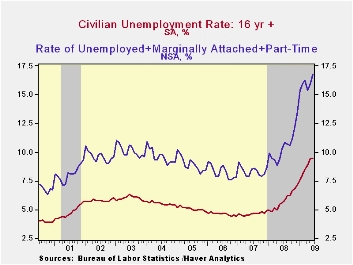
Also notable during this recession is how much the unemployment rate has risen despite slower growth in the labor force. The labor force growth rate of 0.3% y/y through June is down from 1.4% during all of 2006. Drop-outs from the labor force, the so-called discouraged-workers, have been numerous and total 5.9 million, up 26% since the recession began. Had they remained in the labor force the unemployment rate would now stand at 13.3%, up 5.4 percentage points from the recession's start. That compares to the 4.5 percentage point increase in the official unemployment rate to 9.5%.
The labor department also keeps track of why individuals are not working full time, or so-called underemployment. At 6.5 million, the number of those putting in less than 34 hours per week due to slack work has more than doubled since the recession began. Those who could only find part-time work also has doubled to 2.2 million. Even the number of those who found a job and saw it end within a week rose by two-thirds during the last year to 211,000. In all, the jobless rate for the unemployed plus workers who are marginally attached plus those working part-time for economic reasons constitute 16.8% of the labor force, double the 2006-07 low. A dynamic analysis of recent changes in the rate of part-time employment is a 1991 working paper from the Federal Reserve Bank of Cleveland and it can be found here.
 Industry employment trends are behind the relative severity of
the employment patterns above. Factory sector jobs have fallen 14.0%
since the recession began and construction jobs are down 17.1%. Even
for the service sector, which typically is somewhat insulated from the
full force behind cyclical downturns which drive employment lower, this
time is different. Private service sector jobs are off 3.6% from their
peak led by an 8.2% decline in professional & business service
jobs. Jobs in the financial services group also have fallen a severe
5.9%, retail jobs are down 5.1% while government payrolls are up just
slightly.
Industry employment trends are behind the relative severity of
the employment patterns above. Factory sector jobs have fallen 14.0%
since the recession began and construction jobs are down 17.1%. Even
for the service sector, which typically is somewhat insulated from the
full force behind cyclical downturns which drive employment lower, this
time is different. Private service sector jobs are off 3.6% from their
peak led by an 8.2% decline in professional & business service
jobs. Jobs in the financial services group also have fallen a severe
5.9%, retail jobs are down 5.1% while government payrolls are up just
slightly.
| Civilian Unemployment Rate (%) | June | May | June '08 | 2008 | 2007 | 2006 |
|---|---|---|---|---|---|---|
| Total | 9.5 | 9.4 | 5.6 | 5.8 | 4.6 | 4.6 |
| By Sex | ||||||
| Female | 8.3 | 8.0 | 5.3 | 5.4 | 4.5 | 4.6 |
| Male | 10.6 | 10.5 | 5.9 | 6.2 | 4.7 | 4.6 |
| By Age | ||||||
| 16-19 | 24.0 | 22.7 | 18.8 | 18.7 | 15.7 | 15.3 |
| 20 & Over | 8.9 | 8.8 | 5.0 | 5.2 | 4.1 | 4.1 |
| By Educational Attainment | ||||||
| Less Than High School | 15.5 | 15.5 | 8.9 | 9.0 | 7.1 | 6.8 |
| Bachelors Degree or Higher | 4.7 | 4.8 | 2.4 | 2.6 | 2.0 | 2.0 |
| By Race & Age | ||||||
| White | 8.7 | 8.6 | 5.0 | 5.2 | 4.1 | 4.0 |
| 16-19 | 21.4 | 20.3 | 17.0 | 16.7 | 13.9 | 13.2 |
| 20 & Over | 8.1 | 8.1 | 4.4 | 4.6 | 3.7 | 3.6 |
| Black or African American | 14.7 | 14.9 | 9.4 | 10.1 | 8.3 | 8.9 |
| 16-19 | 37.9 | 39.4 | 29.8 | 31.2 | 29.4 | 29.0 |
| 20 & Over | 13.7 | 13.8 | 8.5 | 9.1 | 7.2 | 7.9 |
by Tom Moeller July 20, 2009
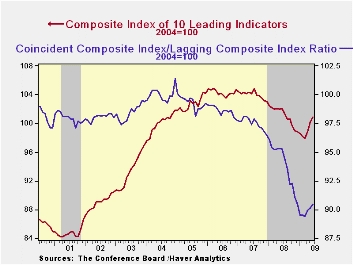
The Conference Board's Index of Leading Economic Indicators continued to suggest a pending economic recovery. The June composite index of leaders rose another 0.7% after gains of 1.3% (upwardly revised) and 1.0% during the prior two months. The combined 3.0% rise during those three months was the strongest since early 2002 while the index itself was at the highest level since last July. The leading index is based on actual reports for eight economic data series. The Conference Board initially estimates two series, orders for consumer goods and orders for capital goods.
For the third straight month, nearly three quarters of the ten components of the leading index increased with the largest positive contributions coming from a steeper yield curve, higher building permits and higher stock prices. The money supply and consumer expectations made slight negative contributions.
Again suggesting that the rate of decline in the economy is
slowing were the coincident indicators. They fell 0.2%, about as they
have for three consecutive months. These compare with monthly declines
of 0.6%-to-1.1% dating back to September. The negative contributions
from lower employment and production have eased. The remaining two
component series actually rose during June, led by very slight gains in
real disposable income and business sales. Over the last ten years
there has been a 76% correlation between this y/y change and real GDP.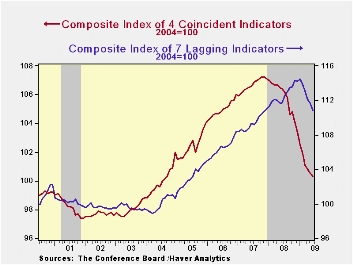
In a sign that excesses in the U.S. economy are diminishing, the lagging index fell for the sixth month in the last seven. The declines have been paced by a longer duration of unemployment, lower commercial and industrial loans and lower consumer installment credit. The ratio of coincident-to-lagging indicators (a measure of economic excess) rose m/m to the highest level since December.
The Conference Board figures are available in Haver's BCI database. Visit the Conference Board's site for coverage of leading indicator series from around the world.
World Economic Outlook Update; Contractionary Forces Receding But Weak Recovery Ahead from the international Monetary Fund can be found here.| Business Cycle Indicators (%) | June | May | April | March 6-Month % (AR) | 2008 | 2007 | 2006 |
|---|---|---|---|---|---|---|---|
| Leading | 0.7 | 1.3 | 1.0 | 4.1 | -2.8 | -0.3 | 1.5 |
| Coincident | -0.2 | -0.3 | -0.7 | -5.9 | -0.8 | 1.6 | 2.5 |
| Lagging | -0.2 | -0.8 | -0.6 | -5.9 | 2.9 | 2.8 | 3.3 |
by Robert Brusca July 20, 2009
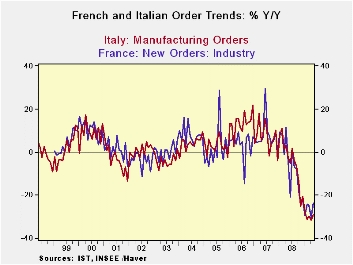
Industrial orders in Italy made a slight bounce in May. French
orders fell after a slight bounce in April. Neither shows any sign of
upward momentum and the downward momentum has only just been trimmed if
we compare 3-month growth rates to 12-month growth rates.
What is interesting is the very different performance in
foreign
orders as between Italy and France and Germany. Germany is showing some
very substantial recovery in foreign-sourced orders. But it Italy,
foreign order are falling at an accelerating pace through May. In
France, foreign orders have shown a clear patterns of progress with the
three-month growth rate reduced to an annual pace of -9.7% compared to
-24% Yr/Yr.
Whatever progress is being experienced in Europe, it is
irregular.
Clearly some economies in the Zone are doing better than others despite
the common currency regime - and that is true for sales overseas
underlining the that exchange rates are not the only factor in the
success of foreign sales efforts. The more variance there is across
e-Zone countries in their respective economic performances, the more it
will wear on the fragile e-Zone area where talk of integration is tough
despite member countries efforts to continue to go it alone on fiscal
policy. Europe still has a recession and still has some divisive
political forces to weather. And yet more European ‘integration’ lies
ahead.
| Saar exept m/m | May-09 | Apr-09 | Mar-09 | 3-mo | 6-mo | 12-mo |
| Total | 0.4% | -3.6% | -2.6% | -20.9% | -24.3% | -29.0% |
| Foreign | 0.2% | -2.9% | -9.3% | -39.4% | -27.5% | -33.0% |
| Domestic | 0.5% | -3.9% | 1.0% | -9.3% | -22.7% | -26.7% |
| Sales | -1.1% | -0.1% | -0.7% | -7.3% | -22.3% | -21.9% |
| French Orders | ||||||
| Saar exept m/m | May-09 | Apr-09 | Mar-09 | 3-mo | 6-mo | 12-mo |
| Total | -1.1% | 0.6% | -5.7% | -22.3% | -9.2% | -23.9% |
| Foreign | 0.4% | 6.5% | -8.8% | -9.7% | -12.4% | -27.0% |
| IP xConstruct | 2.4% | -0.6% | -1.4% | 1.4% | -15.1% | -15.0% |

Tom Moeller
AuthorMore in Author Profile »Prior to joining Haver Analytics in 2000, Mr. Moeller worked as the Economist at Chancellor Capital Management from 1985 to 1999. There, he developed comprehensive economic forecasts and interpreted economic data for equity and fixed income portfolio managers. Also at Chancellor, Mr. Moeller worked as an equity analyst and was responsible for researching and rating companies in the economically sensitive automobile and housing industries for investment in Chancellor’s equity portfolio. Prior to joining Chancellor, Mr. Moeller was an Economist at Citibank from 1979 to 1984. He also analyzed pricing behavior in the metals industry for the Council on Wage and Price Stability in Washington, D.C. In 1999, Mr. Moeller received the award for most accurate forecast from the Forecasters' Club of New York. From 1990 to 1992 he was President of the New York Association for Business Economists. Mr. Moeller earned an M.B.A. in Finance from Fordham University, where he graduated in 1987. He holds a Bachelor of Arts in Economics from George Washington University.
More Economy in Brief


