 Global| Mar 06 2009
U.S. Unemployment Rate of 8.1% Highest Since 1983. Payroll Loss Near the Biggest Since 1949
by:Tom Moeller
|in:Economy in Brief
Summary
Hemorrhaging of workers continued last month in the U.S. labor market according to the Bureau of Labor Statistics. The unemployment rate jumped to 8.1% which was the highest level since December of 1983. The rate increase exceeded [...]
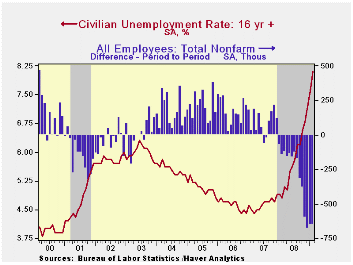
Hemorrhaging of workers continued last month in the U.S. labor market according to the Bureau of Labor Statistics. The unemployment rate jumped to 8.1% which was the highest level since December of 1983. The rate increase exceeded Consensus expectations of 7.9%. The latest rise was forced by a 351,000 drop in household employment (-3.0% y/y) that followed the plummet of 1,239,000 during January. The labor force recovered 498,000 (0.5% y/y) after a sharp January decline.
The labor force participation rate held roughly steady at 65.6%, close to its lowest since 1987. However, the number of potential workers who were not in labor force but wanted a job, i.e. the "discouraged worker," rose by 18.2% y/y. Overall, the number of those who were unemployed last month rose 851,000. The figure was up 5.0 million, or 68.0%, during the last twelve months.
The average duration of unemployment held steady at 19.8 weeks, near the highest since 1983. The number of those unemployed for more than 27 weeks rose another 10.2%, more than doubling year-to-year.
From the establishment survey, nonfarm payrolls were slashed
in February by near the most for any one month since 1949. The 651,000
cut followed declines during the prior two months that were much deeper
than reported earlier (see table below). The February decline about
matched Consensus expectations.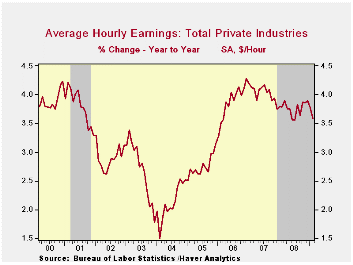
Aggregate hours worked (employment time hours) fell 0.7% last month after a 0.6% January decline. So far in the first quarter aggregate hours worked are down at a 6.9% annual rate from 4Q08.
Private service sector employment dropped 384,000, close to the largest drop for any one month during the last 60 years. Over the last three months 1,431,000 jobs were shed, or 1.5% of the total. During that period 446,000 jobs (-2.6%) were lost from the professional & business services sector and 129,000 jobs (-1.6%) were lost from the financial services sector. The leisure & hospitality industry shed 102,000 jobs (-0.8%) during the last three months and 166,100 were cut (-1.1%) from the retail sector, close to the largest drop since 1958. About the only sector to show growth in jobs was health services where jobs rose 80,600 during the last three months, or by 0.6%. Jobs in education also rose a moderate 13,200 during that period (0.4%).
Factory sector jobs fell 168,000 last month and they have fallen 1,215,000 over the last twelve months (-8.9%). Production worker employment fell by 10.7% during that period with motor vehicle employment down 24.7% and furniture jobs down 17.7%. In the apparel sector, jobs fell 13.1% during the last twelve months.
Construction sector employment fell another 104,000 during February and over the last three months alone 320,000 jobs were cut, or by 4.6%. Hardest hit was the residential building sector where 43,400 jobs (-5.6%) were lost over the last three months alone. Over the last twelve months 826,000 jobs were shed (-11.1%) from the construction sector overall.
Comparing Current Payroll Employment Changes with
Past Recessions from the Federal Reserve Bank of Cleveland
is available here.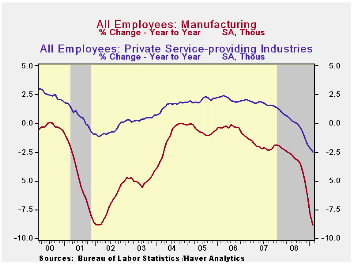
The weakness in private sector hiring has been barely dented by job gains in the government sector where payrolls rose 9,000 last month last month (0.7% y/y). Moreover, there has been no net-hiring by governments since this past summer. State & local government hiring has been slightly negative since the summer while hiring by the federal government rose slightly.
The length of the average workweek remained stable during February at the reduced level of 33.3 hours. It continued as the shortest workweek on record and was down by five hours from the peak during the mid-1960s.
The one month diffusion index, which measures the breadth of job gain or loss (50 is the break-even level) remained near its lowest level of this cycle (23.8%). The three-month index reached a new cycle low of 16.8%. The three-month figure for the factory sector continued weaker at 5.4%.
Average hourly earnings rose 0.2% and that matched Consensus expectations. Earnings the construction industry fell 0.5% (+4.0% y/y) while in the factory sector they rose 0.5% (3.1% y/y) as employers held on to their most productive workers. Private services wages rose 0.5% (4.1% y/y).
The figures referenced above are available in Haver's USECON database. Additional detail can be found in the LABOR and in the EMPL databases.
American International Group is yesterday's testimony by Fed Vice Chairman Donald L Kohn and it is available here.
Credit Market Competition and the Nature of Firms from the Federal Reserve Bank of New York can be found here.
| Employment: 000s | February | January | December | Y/Y | 2008 | 2007 | 2006 |
|---|---|---|---|---|---|---|---|
| Payroll Employment | -651 | -655 | -681 | -3.0% | -0.4% | 1.1% | 1.8% |
| Previous | -- | -577 | -597 | -- | -0.3% | 1.1% | 1.8% |
| Manufacturing | -168 | -257 | -180 | -8.9% | -3.3% | -2.0% | -0.5% |
| Construction | -104 | -118 | -98 | -11.1% | -5.5% | -0.8% | 4.9% |
| Service Producing | -375 | -276 | -399 | -1.9% | 0.2% | 1.6% | 1.8% |
| Average Weekly Hours | 33.3 | 33.3 | 33.3 | 33.8 (Feb. '08) | 33.6 | 33.8 | 33.9 |
| Average Hourly Earnings | 0.2% | 0.2% | 0.3% | 3.6% | 3.8% | 4.0% | 3.9% |
| Unemployment Rate | 8.1% | 7.6% | 7.2% | 4.8% Feb. '08) | 5.8% | 4.6% | 4.6% |
by Robert Brusca March 6, 2009
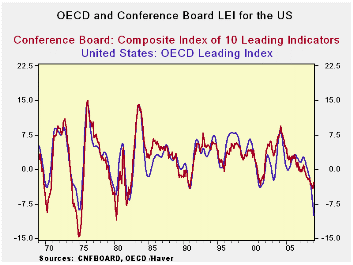
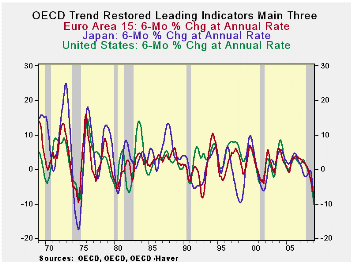
The plunge in the US, Japan and European LEIs is quite
characteristic of recession as the chart on top demonstrates. However,
the severity of the declines is unusual. In the past 40-Years only the
1973-75 downturn produced larger declines for the US. Japan’s decline
is already steeper than its 1973-75 recession drop; Europe’s is about
the same and the US drop is not (yet?) as severe.
However the OECD framework shows that the declines across most
regions are accelerating. Across 6-mo intervals all the main groups are
declining increasingly rapidly over each of the last two six month
segments (bottom panel of table). Separate progressive growth rates
(top panel of table) show that that over three months the growth rate
in Europe has showed some recovery compared to its performance over six
months. But that ‘improvement’ is not by much.
The chart below shows that the OECD and US Conference Board
indices (LEIs) have different views of the US situation. In past deep
downturns the Conference Board index fell by more. In this episode- -
at least at this point of the downturn – the OECD index is showing a
substantially sharper US decline and one that is accelerating instead
of moderating as in the US treatment from the Conference Board Index.
On balance the OECD signal for the US is much worse than from
the US own LEI that has actually stated to turn up (less down) in
January. More topical data from Europe for February suggests that
conditions there continue to weaken. The LEI signal is not infallible
and may not always give the most prescient look ahead. But it is only
one index- a single number- and only so much can be expected from it.
History is quite kind to the LEI gauge as the frame work has a very
good and consistent cyclical signal. For the moment the message is
quite clear that the OECD is not signaling that the worst is over. It
is signaling that we are still in the middle of a difficult and severe
downturn- quite severe by the standards of the past 40 years – and that
continued vigilance is recommended. It’s a very good thing that the ECB
joined the BOE in rate cuts this past week. Clearly the cut was needed.
As for the US discrepancy in the LEI signals that obviously
bears some watching.
| OECD Trend-restored leading Indicators | ||||
|---|---|---|---|---|
| Growth progression-SAAR | ||||
| 3Mos | 6Mos | 12mos | Yr-Ago | |
| OECD | -12.8% | -9.9% | -5.6% | 1.3% |
| OECD7 | -14.7% | -11.3% | -6.6% | 0.7% |
| OECD. Eur | -11.3% | -9.5% | -6.0% | 1.4% |
| OECD. Japan | -14.1% | -9.9% | -4.0% | -1.9% |
| OECD US | -17.4% | -12.8% | -7.6% | 1.2% |
| Six month readings at 6-Mo Intervals: | ||||
| Recent six | 6Mo Ago | 12Mo Ago | 18MO Ago | |
| OECD | -9.9% | -1.1% | -0.3% | 3.0% |
| OECD7 | -11.3% | -1.6% | -1.1% | 2.5% |
| OECD. Eur | -9.5% | -2.2% | 0.5% | 2.3% |
| OECD. Japan | -9.9% | 2.2% | -2.6% | -1.2% |
| OECD US | -12.8% | -2.1% | -1.4% | 3.8% |
| Slowdowns indicated by BOLD RED | ||||

Tom Moeller
AuthorMore in Author Profile »Prior to joining Haver Analytics in 2000, Mr. Moeller worked as the Economist at Chancellor Capital Management from 1985 to 1999. There, he developed comprehensive economic forecasts and interpreted economic data for equity and fixed income portfolio managers. Also at Chancellor, Mr. Moeller worked as an equity analyst and was responsible for researching and rating companies in the economically sensitive automobile and housing industries for investment in Chancellor’s equity portfolio. Prior to joining Chancellor, Mr. Moeller was an Economist at Citibank from 1979 to 1984. He also analyzed pricing behavior in the metals industry for the Council on Wage and Price Stability in Washington, D.C. In 1999, Mr. Moeller received the award for most accurate forecast from the Forecasters' Club of New York. From 1990 to 1992 he was President of the New York Association for Business Economists. Mr. Moeller earned an M.B.A. in Finance from Fordham University, where he graduated in 1987. He holds a Bachelor of Arts in Economics from George Washington University.
More Economy in Brief


