 Global| Feb 05 2010
U.S. Unemployment Rate FallsSharply; Payroll Decline Is Modest
by:Tom Moeller
|in:Economy in Brief
Summary
Past gloom in the job market eased last month. During January the unemployment rate fell to 9.7%, its lowest level since August. Expectations had been for a stable 10.0% unemployment rate. Nevertheless, the figure hardly suggests [...]
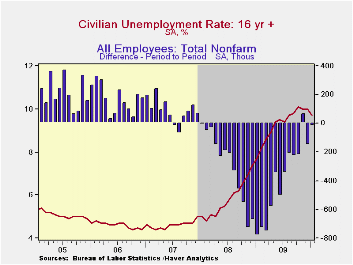
Past gloom in the job market eased last month. During January the unemployment rate fell to 9.7%, its lowest level since August. Expectations had been for a stable 10.0% unemployment rate. Nevertheless, the figure hardly suggests ebullience in the job market since the rate still is up two percentage points from last January. Moreover, the unemployment rate including marginally attached workers plus those working part time for economic reasons slipped m/m to 16.5% but remained up from 14.0% last January.
 Noteworthy is that the overall unemployment rate's decline
resulted from a 541,000 (-2.7% y/y) increase in employment. It was the
largest monthly gain since November 2007 and reflected a 529,000
increase (-1.3% y/y) in adult female employment. Adult male jobs
slipped 1,000 (-3.1% y/y). Along with the rise in the number of jobs
came a 111,000 person increase in the labor force (-0.6% y/y) which was
the first monthly gain since August. The labor force participation rate
thus increased to 64.7% but remained down sharply from 66.0% during all
of 2008. Continued severe weakness in the job market was indicated by
the increase in the average duration of unemployment to 30.2 weeks.
Noteworthy is that the overall unemployment rate's decline
resulted from a 541,000 (-2.7% y/y) increase in employment. It was the
largest monthly gain since November 2007 and reflected a 529,000
increase (-1.3% y/y) in adult female employment. Adult male jobs
slipped 1,000 (-3.1% y/y). Along with the rise in the number of jobs
came a 111,000 person increase in the labor force (-0.6% y/y) which was
the first monthly gain since August. The labor force participation rate
thus increased to 64.7% but remained down sharply from 66.0% during all
of 2008. Continued severe weakness in the job market was indicated by
the increase in the average duration of unemployment to 30.2 weeks.
 Accompanying improvement in the household survey was just a
modest 20,000 worker decline in the establishment survey measure of
nonfarm payrolls. Any easing of the weakness, however, is mitigated by
the benchmark revision which lowered employment by roughly 825,000 last
year. Since the recession began in December of 2007, payrolls have thus
declined by 8.4 million. A 13,000 increase in nonfarm payrolls was the
Consensus expectation.
Accompanying improvement in the household survey was just a
modest 20,000 worker decline in the establishment survey measure of
nonfarm payrolls. Any easing of the weakness, however, is mitigated by
the benchmark revision which lowered employment by roughly 825,000 last
year. Since the recession began in December of 2007, payrolls have thus
declined by 8.4 million. A 13,000 increase in nonfarm payrolls was the
Consensus expectation.
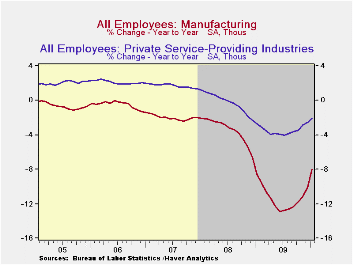
Factory sector payrolls, with an 11,000 increase, posted their
first monthly gain in three years. Private service sector employment
also rose, for the second time during this economic recovery, due to a
44,000 increase (-3.3% y/y) in professional & business services
employment. Also improved was the number of temporary help services
jobs which rose for the fourth straight month (-0.5% y/y). Counter to
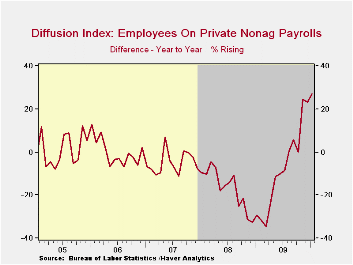
these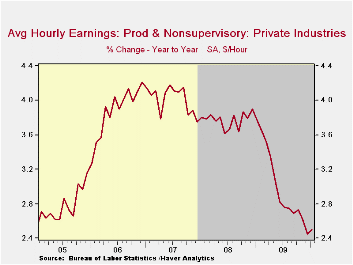 improvements, construction employment fell 75,000 which was the
largest decline since July. Overall the diffusion index of employees on
private nonfarm payrolls rose to 46.8% which was the highest level
since March of 2008. In the government sector payrolls slipped 8,000
(-0.5% y/y) despite a 33,000 rise in federal government hiring
associated with the taking of the census. State government employment
fell 18,000 (-0.8% y/y) and local employment was off 23,000 (-0.9% y/y).
improvements, construction employment fell 75,000 which was the
largest decline since July. Overall the diffusion index of employees on
private nonfarm payrolls rose to 46.8% which was the highest level
since March of 2008. In the government sector payrolls slipped 8,000
(-0.5% y/y) despite a 33,000 rise in federal government hiring
associated with the taking of the census. State government employment
fell 18,000 (-0.8% y/y) and local employment was off 23,000 (-0.9% y/y).
The length of the average workweek also showed improvement, albeit slight. The rise to 33.3 hours was the third rise in the last four months. Together with the diminished decline in employment it raised the level of aggregate hours worked by 0.3% from December and by 0.5% from the 4Q average.
Average hourly earnings improved with the lessened job losses and rose 0.3% which the largest rise since October. Nevertheless, y/y growth fell to 2.5% which was near the cycle low and down from 3.8% growth in 2008.
The figures referenced above are available in Haver's USECON database. Additional detail can be found in the LABOR and in the EMPL databases.
| Employment: 000s | January | December | November | Y/Y | 2009 | 2008 | 2007 |
|---|---|---|---|---|---|---|---|
| Payroll Employment | -20 | -150 | 64 | -3.0% | -4.3% | -0.6% | 1.1% |
| Previous | -- | -85 | 4 | -- | -3.7% | -0.4% | 1.1% |
| Manufacturing | 11 | -23 | -25 | -8.0% | -11.3% | -3.4% | -2.0% |
| Construction | -75 | -32 | -15 | -14.1% | -15.7% | -6.1% | -0.8% |
| Private Service Producing | 48 | -69 | 108 | -2.1% | -3.5% | -0.2% | 1.7% |
| Government | -8 | -27 | -11 | -0.5% | 0.2% | 1.3% | 1.1% |
| Average Weekly Hours | 33.3 | 33.2 | 33.2 | 33.3 (Jan. '09) | 33.1 | 33.6 | 33.8 |
| Average Hourly Earnings | 0.3% | 0.2% | 0.1% | 2.5% | 3.0% | 3.8% | 4.0% |
| Unemployment Rate | 9.7% | 10.0% | 10.0% | 7.7% (Jan. '09) | 9.3% | 5.8% | 4.6% |
by Robert Brusca February 5, 2010
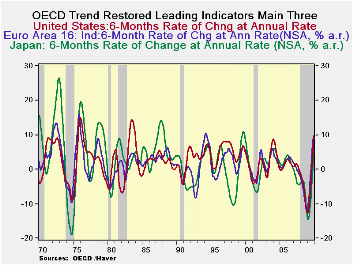
The six-month progressions show that the OECD LEIs are getting progressively stronger. Over 12-months growth rates are positive; annualized rates accelerate over six months but growth rates backed off over three months.
The OECD and its main countries are showing consistent and strong growth rates over the most recent six months.
The 7% to 10% growth rates over 12-months are in excess of what we have seen in the past two recoveries. Japan is still lagging in this cycle with a 12-month gain of only 3.5%. But the e-Zone is up by 9.7% and the US indicator is up by 7.3% over 12 months. Japan is showing strong growth in its LEI over three-months.
The OECD series still seems to endorse the idea of a recovery that will gain momentum and become strong.
| OECD Trend-Restored Leading Indicators | ||||
|---|---|---|---|---|
| Growth progression-SAAR | ||||
| 3Mos | 6Mos | 12mos | Yr-Ago | |
| OECD | 9.4% | 11.9% | 8.3% | -10.8% |
| OECD7 | 9.8% | 12.5% | 7.8% | -11.6% |
| OECD.Ezone | 9.5% | 12.3% | 9.7% | -11.6% |
| OECD.Japan | 10.3% | 11.4% | 3.5% | -11.4% |
| OECD US | 10.1% | 12.4% | 7.3% | -11.5% |
| Six Month Readings at 6-Mo Intervals: | ||||
| Recent six | 6Mo Ago | 12Mo Ago | 18MO Ago | |
| OECD | 11.9% | 4.7% | -15.9% | -5.3% |
| OECD7 | 12.5% | 3.2% | -17.3% | -5.5% |
| OECD.Eur | 12.3% | 7.1% | -15.4% | -7.7% |
| OECD.Japan | 11.4% | -3.9% | -19.3% | -2.8% |
| OECD US | 12.4% | 2.4% | -17.9% | -4.5% |
| Slowdowns indicated by BOLD RED | ||||

Tom Moeller
AuthorMore in Author Profile »Prior to joining Haver Analytics in 2000, Mr. Moeller worked as the Economist at Chancellor Capital Management from 1985 to 1999. There, he developed comprehensive economic forecasts and interpreted economic data for equity and fixed income portfolio managers. Also at Chancellor, Mr. Moeller worked as an equity analyst and was responsible for researching and rating companies in the economically sensitive automobile and housing industries for investment in Chancellor’s equity portfolio. Prior to joining Chancellor, Mr. Moeller was an Economist at Citibank from 1979 to 1984. He also analyzed pricing behavior in the metals industry for the Council on Wage and Price Stability in Washington, D.C. In 1999, Mr. Moeller received the award for most accurate forecast from the Forecasters' Club of New York. From 1990 to 1992 he was President of the New York Association for Business Economists. Mr. Moeller earned an M.B.A. in Finance from Fordham University, where he graduated in 1987. He holds a Bachelor of Arts in Economics from George Washington University.
More Economy in Brief


