 Global| Dec 14 2005
U.S. Trade Deficit Widened Unexpectedly
by:Tom Moeller
|in:Economy in Brief
Summary
The October U.S. foreign trade deficit widened to a record $68.9B from a little revised $66.0B in September. Consensus expectations had been for a narrowing to $62.5B. In the wake of Hurricanes Katrina & Rita imports of petroleum [...]
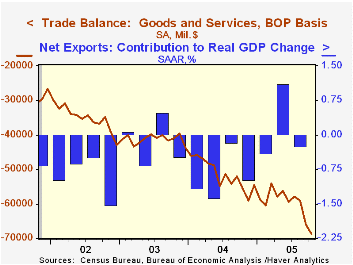
The October U.S. foreign trade deficit widened to a record $68.9B from a little revised $66.0B in September. Consensus expectations had been for a narrowing to $62.5B.
In the wake of Hurricanes Katrina & Rita imports of petroleum products, notably gasoline, surged 23.3% on top of a 27.9% September jump to a level nearly double last October's and up nearly four-fold from the 2003 monthly average.
That spike lifted overall imports by 2.7% for the second consecutive month, despite a decline in crude oil prices to $56.29 per bbl. and petroleum prices overall that were roughly flat m/m.
Imports of nonauto consumer goods were strong as well and posted a 1.2% rise (9.7% y/y), goosed additionally by a 3.9% (7.0% y/y) rise in automotive imports. Capital goods imports fell 0.3% (+7.8% y/y) but imports of advanced technology products jumped 4.9% (NSA, 7.7% y/y).
Total exports gained back most of the prior month's 2.4% collapse with a 1.7% jump. Capital goods exports rose 6.2% (9.8% y/y) with the end of the four-week strike at Boeing Co. that drove exports of civilian aircraft up nearly three-fold m/m (33.1% y/y). Exports of advanced technology products also rose a strong 10.4% (NSA, 6.6% y/y). Exports of capital goods overall rose a strong 6.2% (9.8% y/y) although consumer goods exports fell 5.6% (+5.8% y/y).
Services exports were about flat m/m (+10.4% y/y) as private travel fell 1.8% (+12.5% y/y) though "other" private transportation services rose 1.2% (14.3% y/y).
The US trade deficit with China widened to another record of $20.5B ($161.9B in 2004) due to imports which jumped 4.8% (NSA, 23.9% y/y) though exports surged as well by 22.2% (NSA, 32.7% y/y). The US trade deficit with Japan deepened sharply m/m to $7.4B ($75.6B in 2004) due to a 12.6% (NSA, 6.9% y/y) surge in imports and the monthly trade deficit with the Asian NICs deepened to $1.6B ($21.9B in 2004). The deficit with the European Union deepened sharply to $12.1B ($109.3B in 2004) due to a 13.0% (14.5% y/y) jump in imports.
| Foreign Trade | Oct | Sept | Y/Y | 2004 | 2003 | 2002 |
|---|---|---|---|---|---|---|
| Trade Deficit | $68.9B | $66.0B | $55.6B (10/04) | $617.6B | $494.8B | $421.2B |
| Exports - Goods & Services | 1.7% | -2.4% | 9.2% | 12.6% | 4.6% | -3.0% |
| Imports - Goods & Services | 2.7% | 2.7% | 14.5% | 16.6% | 8.5% | 2.1% |
by Tom Moeller December 14, 2005
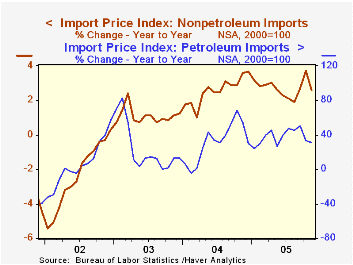
The 1.7% decline in import prices last month was three times expectations for a 0.5% drop. The main source of last month's price weakness was an 8.0% drop in petroleum prices. Crude oil prices fell 6.2% and "other" petroleum prices fell 26.2%.
Last month's surprise, however, was that excluding petroleum prices fell 0.2% after two months of 0.9% gain. Prices for nonauto consumer goods fell 0.2% (+0.8% y/y) and capital goods prices were unchanged (-0.7% y/y). Excluding another decline in computer prices, capital goods prices also were unchanged (+1.9% y/y).
During the last ten years there has been a 66% (negative) correlation between the nominal trade-weighted exchange value of the US dollar vs. major currencies and the y/y change in non oil import prices. The correlation is a lower 47% against a broader basket of currencies and a lower 57% against the real value of the dollar.
Export prices also were weak. The 0.9% drop was due to a 0.2% (-0.7% y/y) decline in capital goods prices and no change in nonauto consumer goods prices (0.8% y/y).
| Import/Export Prices (NSA) | Nov | Oct | Y/Y | 2004 | 2003 | 2002 |
|---|---|---|---|---|---|---|
| Import - All Commodities | -1.7% | 0.3% | 7.0% | 5.6% | 2.9% | -2.5% |
| Petroleum | -8.0% | -1.0% | 30.8% | 30.5% | 21.0% | 3.0% |
| Non-petroleum | -0.2% | 0.9% | 2.6% | 2.6% | 1.1% | -2.4% |
| Export - All Commodities | -0.9% | 0.7% | 2.4% | 3.9% | 1.6% | -1.0% |
by Tom Moeller December 14, 2005
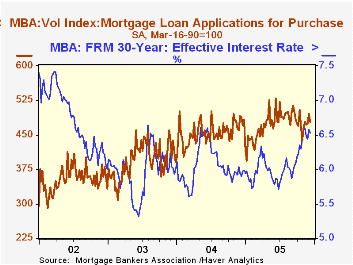
According to the Mortgage Bankers Association, the total number of mortgage applications plunged last week by 5.7% and erased all of the prior weeks' gain. The drop lowered December 1.0% below November.
Purchase applications reversed virtually all of the prior week's rise with a 3.5% decline although increases through much of last month left the average in December 2.9% above November.
Applications to refinance slid 9.7% w/w and the December average is 7.5% below November.
The effective interest rate on a conventional 30-year mortgage slipped to 6.53% from 6.58% the prior week. Rates averaged 6.52% in November and averaged 5.81% in June. The effective rate on a 15-year mortgage also fell to 6.15%. The interest rates on 15 and 30 year mortgages are closely correlated (>90%) with the rate on 10 year Treasury securities.
The Mortgage Bankers Association surveys between 20 to 35 of the top lenders in the U.S. housing industry to derive its refinance, purchase and market indexes. The weekly survey accounts for more than 40% of all applications processed each week by mortgage lenders. Visit the Mortgage Bankers Association site here.
| MBA Mortgage Applications (3/16/90=100) | 12/09/05 | 12/02/05 | Y/Y | 2004 | 2003 | 2002 |
|---|---|---|---|---|---|---|
| Total Market Index | 619.3 | 656.7 | -10.1% | 735.1 | 1,067.9 | 799.7 |
| Purchase | 477.9 | 495.1 | -2.2% | 454.5 | 395.1 | 354.7 |
| Refinancing | 1,441.8 | 1,596.4 | -22.2% | 2,366.8 | 4,981.8 | 3,388.0 |
by Carol Stone December 14, 2005
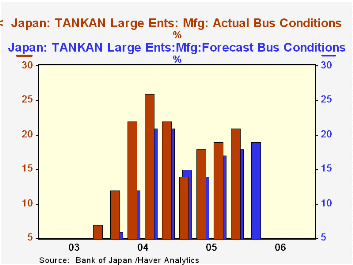
Nearly all segments of Japanese business had better results than they anticipated in the Bank of Japan's quarterly "TANKAN" Survey. Most notably, the large manufacturing firms, which constitute the closely watched "headline" group, saw their diffusion index gain 2 points from September to +21, the highest since a year ago and comparing favorably to the reading of +18 forecast by those companies last quarter. Large nonmanufacturing companies also saw a better-than-expected outturn, +17, against +16 forecast and a +15 actual in September. These businesses are circumspect about the coming quarter, however, with forecasts for March of +19 for manufacturers, down 2 points, and +17 for nonmanufacturers, a steady reading.
By industry, for large firms in the current survey, the margin of actual results over expectations was favorable in nearly areas; only food production, lumber and electrical machinery failed to beat their own forecasts. Shipbuilding, motor vehicles and paper eased somewhat this quarter from their actual results in Q3, although by less than they had forecast. For nonmanufacturing firms, eight of 11 saw improvement over the Q3 results and six of 11 beat their forecasts for this quarter; one, leasing, just met its forecast, which called for a 3 point rise.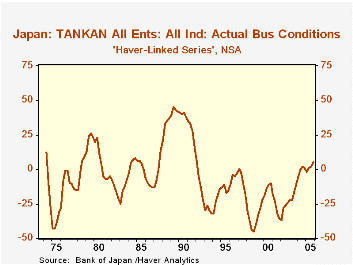
Among medium-sized firms (capital ¥100 million to under ¥1,000 million), manufacturers gained to +9, an improvement of 3 points over their forecast and 4 points over their September results. Even so, they too look for a rollback over the winter to +6 for March. Other businesses in the size category didn't fare as well as forecast, seen in the table below, but conversely, they expected to improve this coming quarter. Small businesses remain mired in recessionary conditions generally, but manufacturers in this segment turned in a respectable +7 for the current quarter, and while still negative, small nonmanufacturing companies experienced much less deterioration than they anticipated.
As we call to your attention frequently, this survey was dramatically reorganized two years ago, most significantly changing the very definition of "size" from employee-based to capital-based. Thus, for example, firms counted as "small" before because they employed fewer than 300 people might now be "large" because they have substantial capital; this is particularly true for high-tech companies. Thus, we continue to separate data for the two periods in the survey in our JAPAN database. However, in G10, where we include some customized series that we calculate, we show a long history for "all firms", which would not have been affected by the modified size criterion. That series, seen in the second graph, was +5 this quarter, the highest reading since Q1 1992, nearly 14 years ago. This suggests, as discussed here Monday by Louise Curley, that the recent downward revision to GDP growth for Q3 was merely a transitory adjustment and not the start of a significant deterioration in the Japanese economy.
| JAPAN: Business Conditions: % Favorable minus % Unfavorable |
December 2005
September 2005
June 2005
||||||
|---|---|---|---|---|---|---|
| Forecast for Mar | Actual | Forecast for Dec | Actual | Forecast for Sep | Actual | |
| All Firms | 4 | 5 | 2 | 2 | 1 | 1 |
| Large Firms* | 18 | 19 | 17 | 17 | 16 | 16 |
| Manufacturing ("Headline Series") | 19 | 21 | 18 | 19 | 17 | 18 |
| Nonmanufacturing | 17 | 17 | 16 | 15 | 14 | 15 |
| Medium-Sized Firms** | 5 | 5 | 3 | 2 | 3 | 4 |
| Manufacturing | 6 | 9 | 6 | 5 | 6 | 8 |
| Nonmanufacturing | 3 | 1 | 2 | 0 | 1 | 1 |
| Small Firms*** | -4 | -2 | -5 | -6 | -7 | -7 |
| Manufacturing | 6 | 7 | 4 | 3 | 1 | 2 |
| Nonmanufacturing | -9 | -7 | -12 | -11 | -13 | -12 |

Tom Moeller
AuthorMore in Author Profile »Prior to joining Haver Analytics in 2000, Mr. Moeller worked as the Economist at Chancellor Capital Management from 1985 to 1999. There, he developed comprehensive economic forecasts and interpreted economic data for equity and fixed income portfolio managers. Also at Chancellor, Mr. Moeller worked as an equity analyst and was responsible for researching and rating companies in the economically sensitive automobile and housing industries for investment in Chancellor’s equity portfolio. Prior to joining Chancellor, Mr. Moeller was an Economist at Citibank from 1979 to 1984. He also analyzed pricing behavior in the metals industry for the Council on Wage and Price Stability in Washington, D.C. In 1999, Mr. Moeller received the award for most accurate forecast from the Forecasters' Club of New York. From 1990 to 1992 he was President of the New York Association for Business Economists. Mr. Moeller earned an M.B.A. in Finance from Fordham University, where he graduated in 1987. He holds a Bachelor of Arts in Economics from George Washington University.
More Economy in Brief


