 Global| Mar 11 2008
U.S. Trade Deficit Widened
by:Tom Moeller
|in:Economy in Brief
Summary
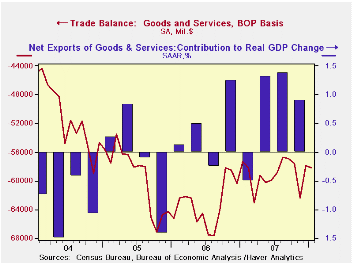
During January the U.S. foreign trade deficit widened to $58.2B from a revised $57.9B in December, which was shallower than initially reported. Consensus expectations had been for a deficit of $59.6B. Lifted by the weaker dollar, U.S. [...]
During January the U.S. foreign trade deficit widened to
$58.2B from a revised $57.9B in December, which was shallower than
initially reported. Consensus expectations had been for a deficit of
$59.6B.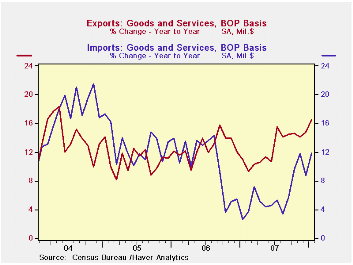
Lifted by the weaker dollar, U.S. exports during January again were strong. They posted a 1.6% jump following the unrevised 1.5% December gain. Exports of goods rose 1.3% (15.2% y/y) as exports of foods, feeds & beverages surged. A 7.6% m/m jump in food exports lifted the y/y rise to 42.0%. Exports of industrial supplies & materials also were quite strong and jumped 2.8% (25.1% y/y). Exports of capital goods have wobbled during the last several months and fell 1.3% (+7.6% y/y) during January. Weaker exports of civilian aircraft accounted for most of that wobble, declining 12.6% (+10.8% y/y). Exports of computers rose 5.2% (6.3% y/y) while exports of nonauto consumer goods were again strong and rose 3.8% (12.9 y/y).
U.S. exports of services in January jumped 1.8% (18.2% y/y).
Travel exports rose 26.0% y/y and passenger fares were up 27.6%.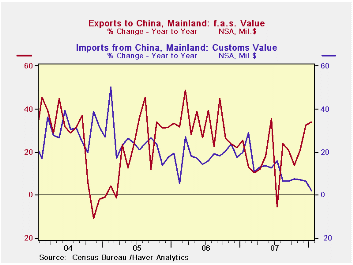
Overall imports fully reversed the December decline and rose 1.3%. Higher oil prices raised nominal petroleum imports by 10.6%. Petroleum imports in constant dollars, however, rose a lesser 8.8% m/m and in fact fell 1.6% during the last twelve months. In constant dollars, imports of nonauto consumer goods reflected the weaker U.S. economy and fell 4.6% (-0.8% y/y) while real capital goods imports fell 0.4% (+2.4% y/y).
The U.S. trade deficit in goods with China deepened m/m to $20.3B but that remained well below last year's monthly record of $25.9B. Growth in imports from China has slowed to 2.1% during the last twelve months after growth between 10% and 30% during the last several years. Exports to China for January showed a 15.1% decline but that followed huge gains during the past several years, also between 10% and 30%.
G-10 central banks announced measures and will consult regularly on liquidity pressures in funding markets. The statement by the Federal Reserve can be found here
| Foreign Trade | January | December | Y/Y | 2007 | 2006 | 2005 |
|---|---|---|---|---|---|---|
| U.S. Trade Deficit | $58.2B | $57.9B | $57.4B (1/07) |
$708.5 | $758.5 | $714.4B |
| Exports - Goods & Services | 1.6% | 1.5% | 16.6% | 12.6% | 12.7% | 10.9% |
| Imports - Goods & Services | 1.3% | -1.2% | 11.9% | 6.0% | 10.4% | 12.9% |
| Petroleum | 10.6% | 3.6% | 59.0% | 9.5% | 20.1% | 39.6% |
| Nonpetroleum Goods | -1.1% | -2.9% | 2.5% | 4.6% | 9.1% | 10.3% |
by Tom Moeller March 11, 2008
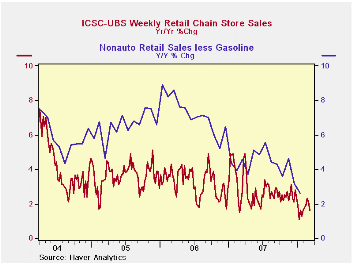
The International Council of Shopping Centers ICSC-UBS Chain Store survey indicated that chain store sales, last week, recovered just 0.3% of the prior period's 0.6% decline. The latest level of sales was about equal to the February average.
During the last ten years there has been a 45% correlation between the y/y change in chain store sales and the change in nonauto retail sales less gasoline.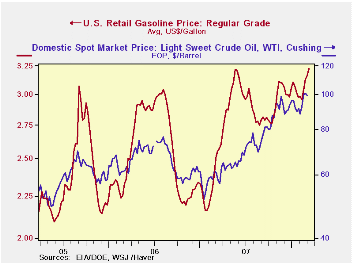
The ICSC-UBS retail chain-store sales index is constructed using the same-store sales (stores open for one year) reported by 78 stores of seven retailers: Dayton Hudson, Federated, Kmart, May, J.C. Penney, Sears and Wal-Mart.
During the latest week the leading indicator of chain store sales from ICSC-UBS recovered 1.0% after sharp declines during the prior two months.The index has trended steadily lower since early January.
Retail gasoline prices last week jumped seven cents to a new high of $3.23 per gallon, according to the U.S. Department of Energy survey.The gain was pushed by the increase in the wholesale price of gasoline which was up another ten cents yesterday from last week's average.
Strength in crude oil prices has driven gasoline prices. Yesterday's price of $107.90was well up from last week's average $103.43 which had risen nearly three dollars from early this month.
| ICSC-UBS (SA, 1977=100) | 03/07/08 | 02/29/08 | Y/Y | 2007 | 2006 | 2005 |
|---|---|---|---|---|---|---|
| Total Weekly Chain Store Sales | 488.3 | 487.0 | 1.6% | 2.8% | 3.3% | 3.6% |
| Weekly Prices | 03/10/08 | 03/03/08 | Y/Y | 2007 | 2006 | 2005 |
|---|---|---|---|---|---|---|
| Retail Gasoline ($ per Gallon) | 3.23 | 3.16 | 26.0% | 2.80 | 2.57 | 2.27 |
| Light Sweet Crude Oil, WTI ($ per bbl.) | 103.43 | 100.88 | 70.0% | 94.00 | 61.11 | 58.16 |
by Tom Moeller March 11, 2008
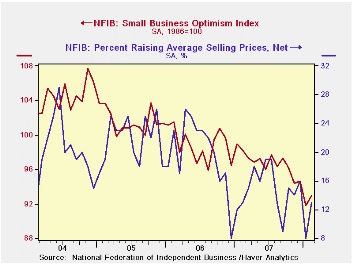
According to the National Federation of Independent Business (NFIB), small business optimism recovered a modest 1.2% during February after the prior month's 3.0% decline. Optimism remained near the lowest level since during the recession of 1990.
During the last ten years there has been a 70% correlation between the level of the NFIB index and the two quarter change in real GDP.
Nine percent fewer respondents expected the economy to improve
following sharp declines during the prior four months. None of the
respondents expected higher real sales in six months. In addition, none
of the respondents indicated that now was a good time to expand the
business.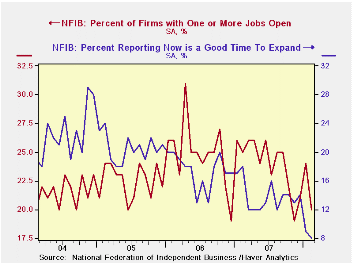
The percent planning to increase employment ticked up slightly from the lowest level since early 2006 and the percentage with one or more job openings reversed all of the prior month's improvement. During the last ten years there has been a 72% correlation between the NFIB percentage and the y/y change in nonfarm payrolls.
The percentage of firms planning to increase capital expenditures rose m/m to 26% but that remained below the average of 29% last year, 30% in 2006 and 32% in 2005.
The percentage of firms actually raising prices rose m/m but, at 13%, remained below last year's average of 15%. During the last ten years there has been a 60% correlation between the change in the producer price index and the level of the NFIB price index. The percentage of firms planning to raise prices also fell to 22% versus last year's average 23% and 27% in 2006.
About 24 million businesses exist in the United States. Small business creates 80% of all new jobs in America.
| Nat'l Federation of Independent Business | February | January | Y/Y | 2007 | 2006 | 2005 |
|---|---|---|---|---|---|---|
| Small Business Optimism Index (1986=100) | 92.9 | 91.8 | -5.4% | 96.7 | 98.9 | 101.6 |
by Louise Curley March 11, 2008
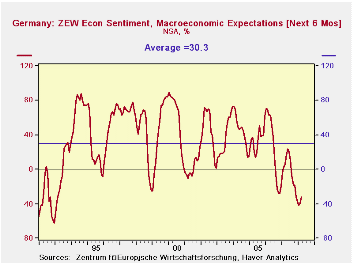
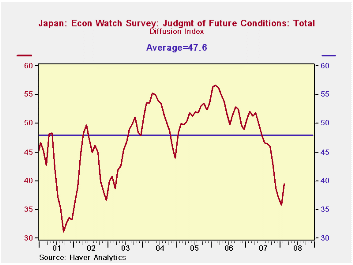
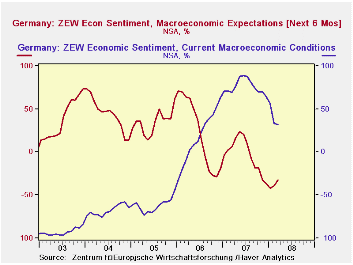
Economy Watchers in Japan and the financial community in Germany (as represented by participants in ZEW Survey) are still deeply concerned about the prospect for the future of their economies. The first and second charts show measures of the future outlook in both countries relative to their long term averages.In Germany, the excess of pessimists over optimist in March was 32.0 percentage points compared with a long term average of and excess of optimists over pessimists of 30.3 percentage points. In Japan, the diffusion index in February was 33.6 compared with a long term average of 47.6.
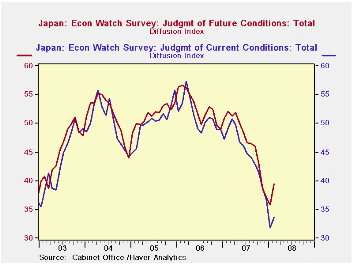
The latest reports, however, suggest that they are beginning to see some slight grounds for optimism. In Japan, the Economy Watchers' diffusion index of current conditions in February rose 1.6 points from January and the diffusion index of future conditions rose 3.7 points. In Germany the financial community continues to downgrade its appraisal of current conditions. The excess of pessimists over optimists appraising the current situation increased by 1.6 percentage points from February to March. However, the excess of pessimists regarding the outlook six months ahead fell by 7.5 percentage points. The third and fourth charts show the appraisals of current condition and the outlook for Germany and Japan.
| GERMANY ZEW INDICATORS (% BALANCE) | Mar 08 | Feb 08 | Mar 07 | M/M Dif | Y/Y Dif | 2006 | 2005 | 2004 |
|---|---|---|---|---|---|---|---|---|
| Current Conditions | 32.1 | 33.7 | 69.2 | -1.6 | -37.1 | 75.9 | 18.3 | -61.8 |
| Expectations 6 Months Ahead | -32.0 | -39.5 | 5.8 | 7.5 | -37.8 | -3.0 | 22.3 | 34.8 |
| JAPAN ECONOMY WATCHERS SURVEY (DIFFUSION INDEXES) | Feb 08 | Jan 08 | Feb 07 | M/M Dif | Y/Y Dif | 2006 | 2005 | 2004 |
| Judgment of Current Conditions | 33.6 | 31.8 | 49.2 | 1.80 | -15.6 | 44.9 | 51.4 | 50.3 |
| Judgment of Future Conditions | 39.5 | 35.8 | 52.1 | 3.70 | -12.60 | 46.9 | 52.9 | 51.5 |
by Robert Brusca March 11, 2008
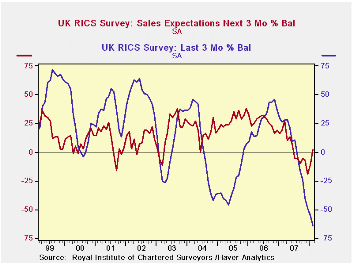
The RICs survey by surveyors that tells the tendency of house
prices to rise or fall is at its weakest level ever. The index is an
up/down net balance reading and the balance of house prices falling is
the largest negative excess over this rising going back to 1999.
Expectations for prices did up tick slightly in February but they too
are near historic lows. Sales expectations are in much better shape by
comparison. They turned higher after a string of negative readings and
stand at a level of +2 in the 41st percentile of their historic range.
That is below the mid-point of the range at 50 but still only a
moderately weak reading.
| RICS: House prices and expectations for prices and sales | |||||||
|---|---|---|---|---|---|---|---|
| Feb-08 | Jan-08 | Dec-07 | 3Mo Avg | 6Mo Avg | 12Mo Avg | Range Percentile | |
| Prices | -64 | -55 | -49 | -56 | -41 | -13 | 0.0% |
| Price Expectations | -58 | -62 | -62 | -61 | -48 | -24 | 4.0% |
| Sales expectations | 2 | -11 | -19 | -9 | -9 | 0 | 41.2% |
| New Sales | -31 | -28 | -20 | -26 | -29 | -18 | 7.3% |
| Range percentile takes range back to 1999 | |||||||

Tom Moeller
AuthorMore in Author Profile »Prior to joining Haver Analytics in 2000, Mr. Moeller worked as the Economist at Chancellor Capital Management from 1985 to 1999. There, he developed comprehensive economic forecasts and interpreted economic data for equity and fixed income portfolio managers. Also at Chancellor, Mr. Moeller worked as an equity analyst and was responsible for researching and rating companies in the economically sensitive automobile and housing industries for investment in Chancellor’s equity portfolio. Prior to joining Chancellor, Mr. Moeller was an Economist at Citibank from 1979 to 1984. He also analyzed pricing behavior in the metals industry for the Council on Wage and Price Stability in Washington, D.C. In 1999, Mr. Moeller received the award for most accurate forecast from the Forecasters' Club of New York. From 1990 to 1992 he was President of the New York Association for Business Economists. Mr. Moeller earned an M.B.A. in Finance from Fordham University, where he graduated in 1987. He holds a Bachelor of Arts in Economics from George Washington University.
More Economy in Brief


