 Global| Mar 09 2006
U.S. Trade Deficit Surged Due to Higher Imports
by:Tom Moeller
|in:Economy in Brief
Summary
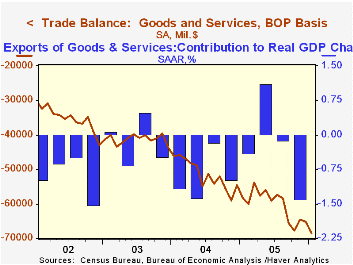
The U.S. foreign trade deficit surged during January to $68.5B, another record, and far exceeded Consensus expectations for a deficit of $66.5B. The December deficit in goods & services trade was revised slightly lower to $65.1B. [...]
The U.S. foreign trade deficit surged during January to $68.5B, another record, and far exceeded Consensus expectations for a deficit of $66.5B. The December deficit in goods & services trade was revised slightly lower to $65.1B.
Overall imports rose 3.5% in January and the gains were quite broad, starting with a 5.6% (48.3%) spike in petroleum imports. That gain was bolstered by a 4.4% rise in crude oil prices (46.0% y/y) to an average $51.93 per bbl., the first m/m gain since September. Crude prices gave back roughly half of that increase last month and very recently fell even lower. The quantity of crude oil imports fell during January (-6.2% y/y) for the second consecutive month.
Imports of nonpetroleum products similarly were strong during January, rising 3.8% (11.2% y/y). The gain was led by a 3.8% (9.9% y/y) rise in capital goods and a 2.9% (5.6% y/y) increase in nonauto consumer goods. Imports of advanced technology products fell 8.1% (NSA, 15.2% y/y).
Total exports also were strong during January. A 2.5% increase was led by a 2.9% (16.3% y/y) gain in capital goods though exports of nonauto consumer goods fell 1.3% (+11.3% y/y). Exports of advanced technology products dropped 10.1% (NSA, +20.7% y/y) while exports of foods, feeds & beverages jumped 11.2% (15.7% y/y).
With China the US trade deficit reversed most of an improvement during December and deteriorated to $17.9B ($201.6B for 2005) but y/y exports were up by more than one third. The trade deficit with Japan improved for the third straight month to $6.5B ($82.7B in 2005) though the trade deficit with the Asian NICs nearly doubled to $2.2B ($15.9B in 2005). The deficit with the European Union improved for the third consecutive month $9.7B ($122.4B in 2005) as imports fell 6.0% (+12.7% y/y).
During 2005, the total real value of US international trade (exports plus imports) rose to 27.2% of constant dollar GDP, up from 20.3% ten years earlier and was more than double the percentage during 1985.
Current account, remarks by Alan Greenspan, are available here.
| Foreign Trade | Jan | Dec | Y/Y | 2005 | 2004 | 2003 |
|---|---|---|---|---|---|---|
| Trade Deficit | $68.5B | $65.1B | $58.3B (1/05) | $723.6B | $617.6B | $494.8B |
| Exports - Goods & Services | 2.5% | 2.2% | 12.0% | 10.5% | 12.6% | 4.6% |
| Imports - Goods & Services | 3.5% | 1.7% | 14.0% | 12.8% | 16.6% | 8.5% |
by Tom Moeller March 9, 2006
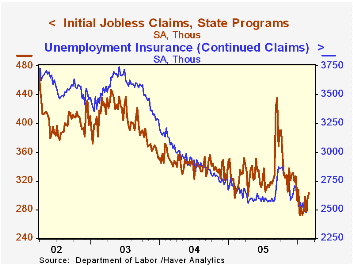
Initial claims for unemployment insurance rose 8,000 to 303,000 to the highest level since early January while the prior week's level was revised up slightly. Consensus expectations had been for a decline to 290,000 claims.
During the last ten years there has been a (negative) 75% correlation between the level of initial jobless insurance claims and the m/m change in payroll employment.
The four-week moving average of initial claims increased to 293,500 (-7.4% y/y), its highest level since mid-January.
Continuing unemployment insurance claims rose 29,000 following a revised 11,000 decline the prior week. It was the first increase in four weeks.
The insured rate of unemployment was stable at 1.9% for the fourth week.
Understanding the employment measures from the CPS and CES survey from the Bureau of Labor Statistics can be found here.
| Unemployment Insurance (000s) | 03/04/06 | 02/25/06 | Y/Y | 2005 | 2004 | 2003 |
|---|---|---|---|---|---|---|
| Initial Claims | 303 | 295 | -9.6% | 332 | 343 | 402 |
| Continuing Claims | -- | 2,505 | -7.0% | 2,663 | 2,924 | 3,532 |
by Tom Moeller March 9, 2006
Growth in total credit market debt outstanding surged 11.4% (AR) last quarter. Faster growth rates often occur during 4Q but that was the quickest since 2002.
The acceleration from 3Q was due to a jump in Federal Government borrowing at a 10.1% rate (7.0% y/y) versus 6.6% in 3Q.
Growth in household sector borrowing continued strong at a 13.2% rate. That was down from the heated pace of the prior quarter but it capped off the fastest yearly rate of household sector borrowing on record by edging out the 11.5% rate of growth during 2003.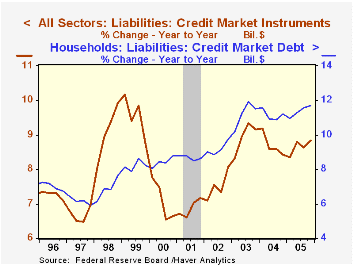
Home mortgage obligations grew at a 14.6% rate (14.1% y/y) last quarter capping the fourth consecutive year of double digit growth. Consumer credit growth slowed substantially to a 4.7% rate from 8.5% during 3Q and the 2.9% yearly rate of growth was the slowest since 1992, likely reflecting mortgage refinancings.
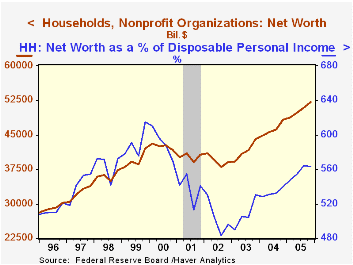
Household sector asset values rose at a 9.8% annual rate (8.5% y/y) during 4Q powered by a 14.0% (14.9% y/y) rise in the value of real estate holdings. Financial asset values rose 8.0% (5.6% y/y) due to an 11.2% (12.9% y/y) rise in the value of mutual fund shares but the value of corporate equities held directly fell 4.4% (-5.0% y/y).
The net worth of the US household sector in 4Q improved 2.3% (8.0% y/y) to a record $52.107 trillion. The gain, however, did not lift net worth as a percentage of income which fell slightly q/q to a still high 5.635 times income. During 2004 that ratio was 5.403 times.
| Flow of Funds | % of Total | 4Q 05 (AR) |
3Q 05 (AR) |
Y/Y | 2005 | 2004 | 2003 |
|---|---|---|---|---|---|---|---|
| Total Credit Market Debt Outstanding | 11.4% | 8.1% | 8.8% | 8.8% | 8.4% | 9.2% | |
| Federal Government | 12% | 10.1% | 6.6% | 7.0% | 7.0% | 9.0% | 10.9% |
| Households | 28% | 13.2% | 14.3% | 11.7% | 11.7% | 11.2% | 11.5% |
| Nonfinancial Corporate Business | 14% | 7.0% | 4.4% | 5.7% | 5.7% | 3.6% | 2.2% |
| Financial Sectors | 32% | 11.9% | 3.4% | 7.5% | 7.5% | 7.6% | 10.1% |
| Net Worth: Households & Nonprofit Organizations (Trillions) | -- | $52.107 | $50.957 | -- | $52.107 | $48.250 | $44.127 |
| Tangible Assets | -- | $25.558 | $24.816 | 13.3% | $25.558 | $22.556 | $20.040 |
by Carol Stone March 9, 2006
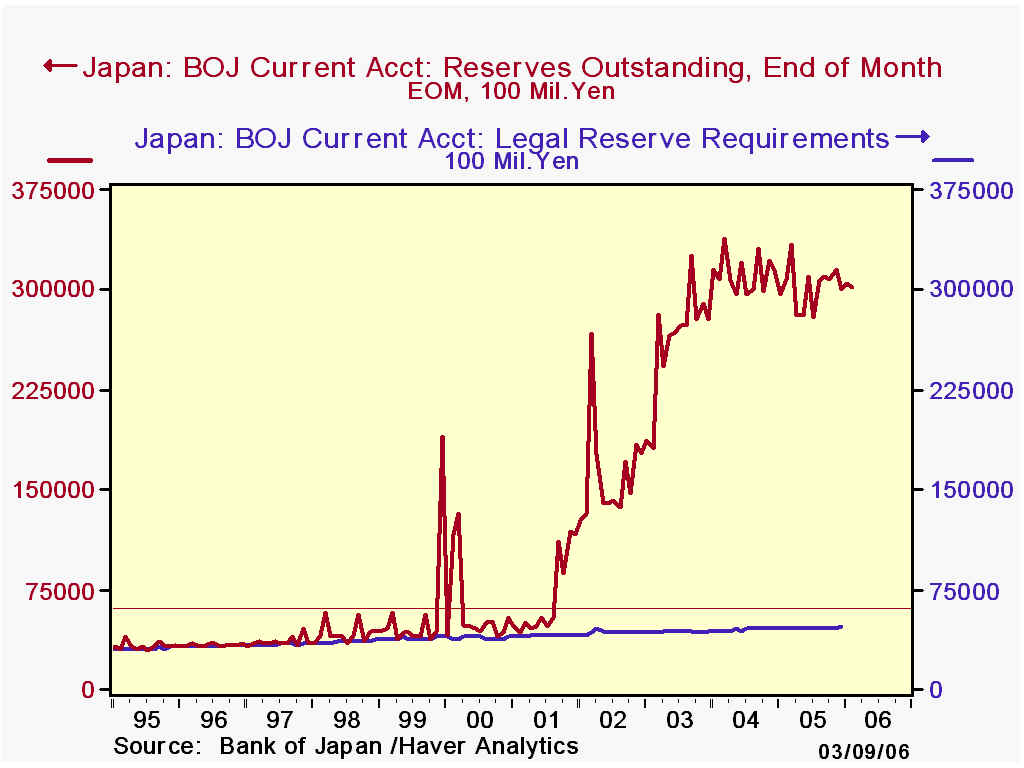
We wrote yesterday in the midst of the monetary policy meeting of the Bank of Japan; we described the voluminous amount of reserves the BoJ has pumped into the banks. As widely expected, the Bank announced that it would reduce this level of reserves, pulling it back toward its more traditional amount. Because bank deposits are not near the levels permitted by the current volume of reserves, no immediate change in short-term interest rates is likely and the Bank indicates that the overnight call money rate should remain near zero.
However, the bank provided these reserves, a liability item on its balance sheet, by substantially increasing its assets, as evident in the first graph here. The BoJ's assets grew quite significantly during two periods of the last 10 years, late 1997-98 following the Asian currency crisis, and from the spring of 2001 through 2002. In this latter period, it bought huge quantities of government securities, particularly bonds, and it began outright buying of short-term commercial bills.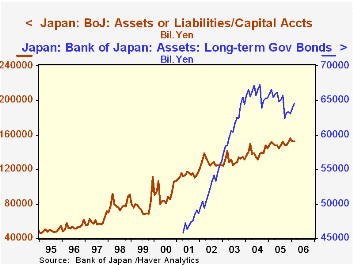
So as the Bank sheds the excess reserves "over a few months", it will be interesting to see what happens to interest rates on the assets the Bank will also shed. The Bank's statement says that it will continue buying long-term government bonds, and that its "un-easing" [our terminology] will occur in short-term money markets. So the Bank is attempting to minimize the impact on interest rates all together. Whether they succeed remains to be seen and it likely depends on the accompanying vigor in the Japanese economy.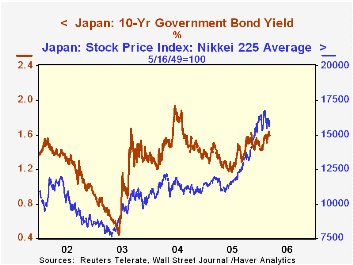
Meantime, after the Bank's announcement in mid-afternoon, markets were actually encouraged, seeing this change in policy as a "vote of confidence" in the Japanese economy. Stock prices rose, with the Nikkei-225 up a whopping 2.6% on the day. And bond yields were little changed, in fact easing ever so slightly. Notably, in addition, even as the BoJ has added significantly to its holdings of government bonds in recent years, yields on them have not moved much. Thus, the yield curve has remained upward sloping, suggesting that investors believed the Bank's policy would eventually work, as it appears to be doing.
[The BoJ accounts and aggregate open market operations are included in Haver's JAPAN database. Daily stock market indexes and interest rates are shown in INTDAILY.]

Tom Moeller
AuthorMore in Author Profile »Prior to joining Haver Analytics in 2000, Mr. Moeller worked as the Economist at Chancellor Capital Management from 1985 to 1999. There, he developed comprehensive economic forecasts and interpreted economic data for equity and fixed income portfolio managers. Also at Chancellor, Mr. Moeller worked as an equity analyst and was responsible for researching and rating companies in the economically sensitive automobile and housing industries for investment in Chancellor’s equity portfolio. Prior to joining Chancellor, Mr. Moeller was an Economist at Citibank from 1979 to 1984. He also analyzed pricing behavior in the metals industry for the Council on Wage and Price Stability in Washington, D.C. In 1999, Mr. Moeller received the award for most accurate forecast from the Forecasters' Club of New York. From 1990 to 1992 he was President of the New York Association for Business Economists. Mr. Moeller earned an M.B.A. in Finance from Fordham University, where he graduated in 1987. He holds a Bachelor of Arts in Economics from George Washington University.
More Economy in Brief


