 Global| Jun 10 2010
U.S. Trade Deficit Stable M/M But Sharply Deeper Since Last Year
by:Tom Moeller
|in:Economy in Brief
Summary
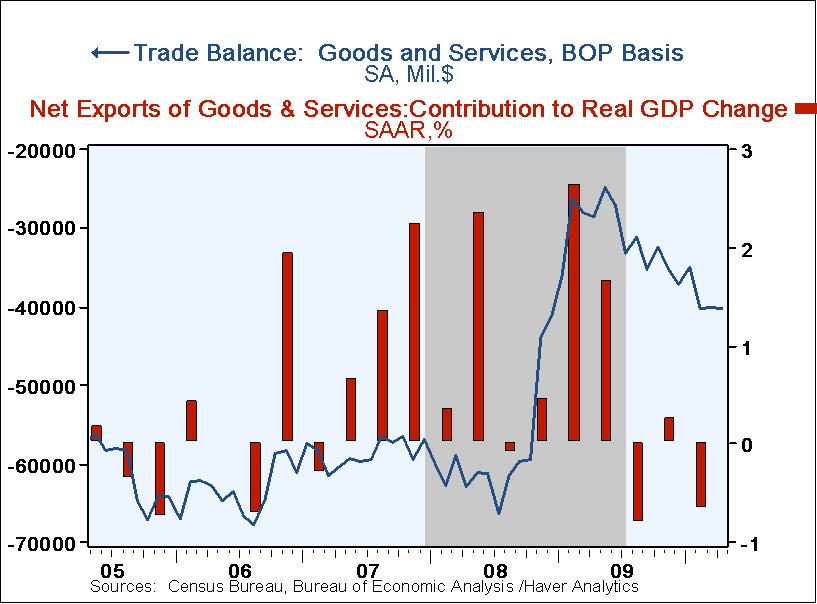
The latest and revised U.S. foreign trade figures paint the same picture as earlier. An April deficit of $40.3B, stable since February, followed deterioration from its shallowest last May. The latest figure roughly matched Consensus [...]
The latest and revised U.S. foreign trade figures paint the same picture as earlier. An April deficit of $40.3B, stable since February, followed deterioration from its shallowest last May. The latest figure roughly matched Consensus expectations for a deficit of $41.0B.
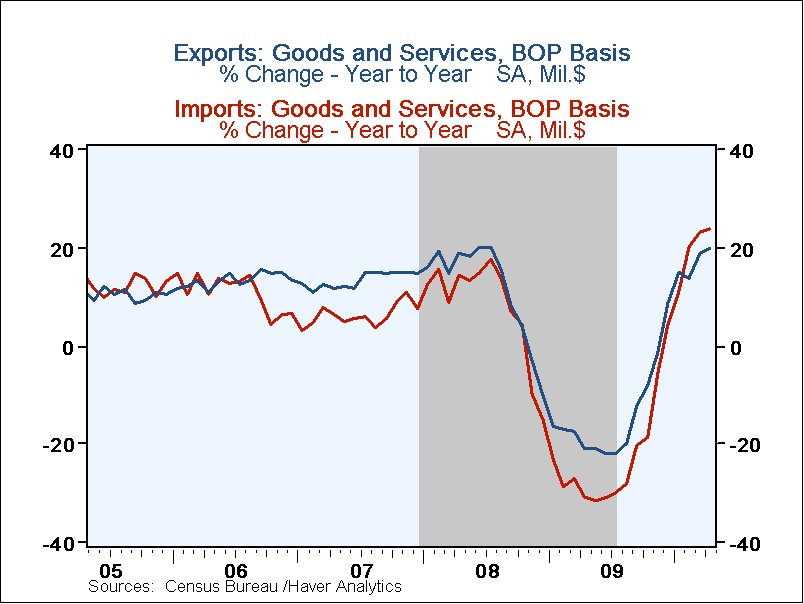
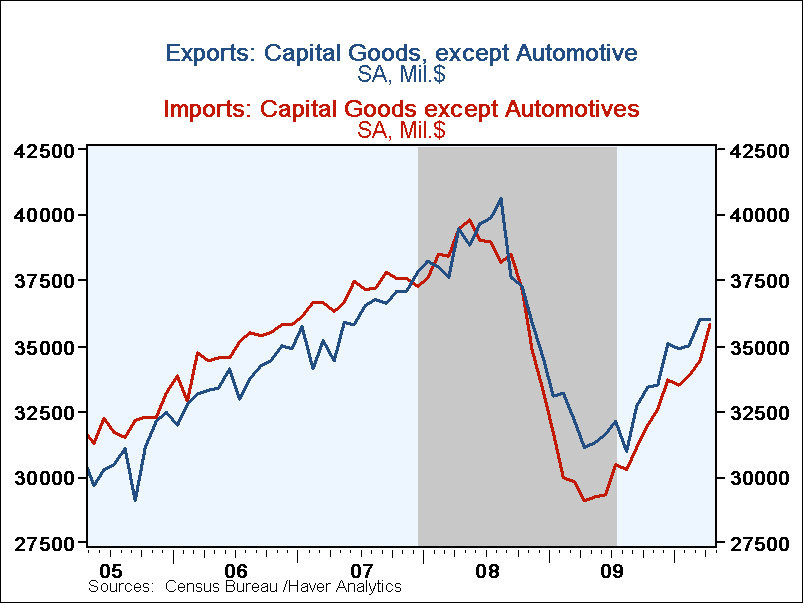
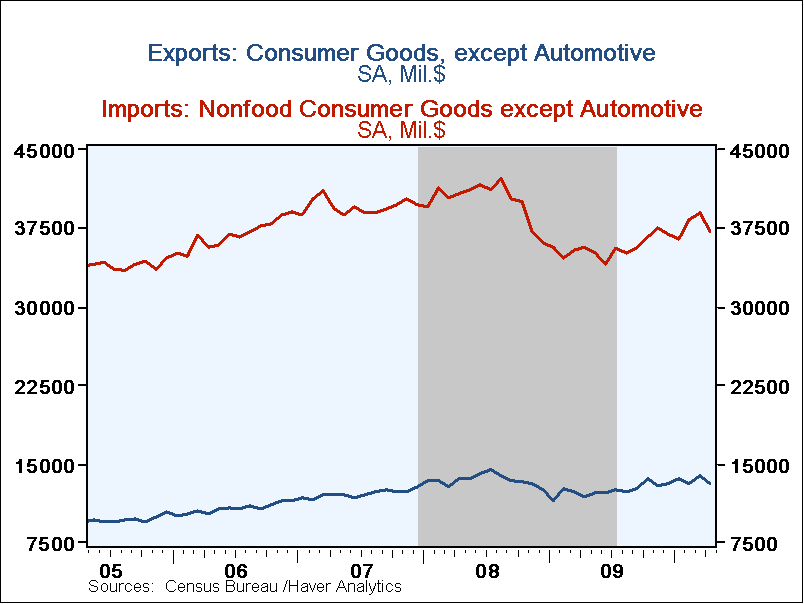
The deficit's deterioration since last year reflects the U.S. economic recovery. Non-oil imports slipped 0.7% in April but it was the first monthly decline in nearly one year. The 21.1% y/y gain during the last twelve months reflects a two-thirds increase in imports of automotive vehicles & parts. Real nonauto consumer goods imports rose 4.0% y/y while capital goods imports jumped by nearly one-quarter with the strength in business investment. Finally, services imports have risen 6.8% y/y. U.S. travels abroad fell 0.7% y/y while passenger fares surged 15.0% y/y. "Other" transportation services imports jumped 7.7% y/y. Imports of petroleum products slipped marginally in April but were up by two-thirds from last year with the surge in prices.
Nominal exports slipped 0.7% during April following their slightly-revised 3.8% jump during March. Year-to-year, however, exports have risen a strong 19.9% with the dollar's lower value. The monthly dip reflected a 5.3% drop in nonauto consumer goods exports (+10.3% y/y) and a 7.6% drop in food & beverages (+4.2% y/y). These were offset by a 1.9% increase (50.3% y/y) in industrial supplies exports and a 1.4% gain (+57.2% y/y) in autos. In addition, exports of services rose 0.2% (8.0% y/y) as passenger fares were strong.
By country, the trade deficit with mainland China deepened to $19.3B, its deepest since December. Trade with China surged as exports jumped by one-quarter y/y and imports rose by a lesser 18.2%. The trade deficit with Japan eased to $4.8B but imports rose by roughly one-third y/y with the U.S. economic recovery and exports rose 17.2% y/y. With the European Union the trade deficit eased to $5.7B as exports rose 7.0% y/y and imports rose about the same.
The international trade data can be found in Haver's USECON database. Detailed figures are available in the USINT database.
| Foreign Trade | April | March | February | Y/Y | 2009 | 2008 | 2007 |
|---|---|---|---|---|---|---|---|
| U.S. Trade Deficit | $40.3B | $40.0B | $40.1B | $28.4B(4/09) | $378.6B | $695.9B | $701.4B |
| Exports - Goods & Services (m/m) | -0.7% | 3.8% | -0.1% | 19.9% | -14.6% | 11.5% | 13.2% |
| Imports - Goods & Services | -0.4 | 2.9 | 2.8 | 23.9 | -23.3 | 8.0 | 6.0 |
| Petroleum | -0.0 | 6.0 | 7.4 | 67.5 | -44.0 | 37.0 | 9.4 |
| Nonpetroleum Goods | -0.7 | 3.2 | 1.9 | 21.1 | -20.9 | 1.5 | 4.8 |
Tom Moeller June 10, 2010
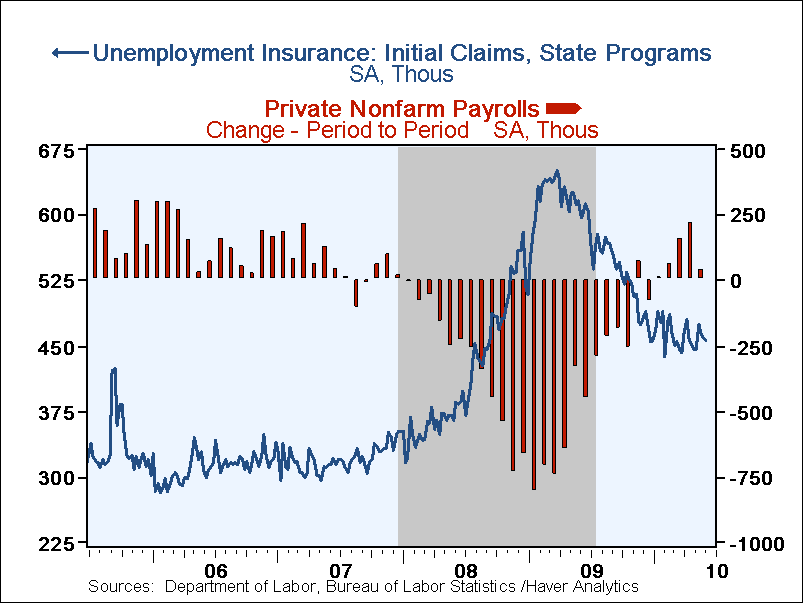 Job market improvement has
been scant this year after material gains during 2009. The Bureau of
Labor Statistics reported that initial claims for jobless insurance
slipped another 3,000 to 456,000 following a 4,000 decline the week
earlier which was less than initially reported. While the latest figure
was slightly lower than Consensus expectations for 448,000, claims have
been hovering near this cycle's low since January. Nevertheless, last
week's figure was down from the recession peak of 651,000 reached in
March of 2009. The four-week moving average of initial claims ticked up
to 463,000.
Continuing claims for unemployment insurance during the latest week broke from their recent sideways movement and dropped a sharp 255,000 to the lowest level since December of 2008. Claims were down by one-third from the June '09 peak. The overall decline is a function of the improved job market but also reflects the exhaustion of 26 weeks of unemployment benefits. Continuing claims provide an indication of workers' ability to find employment. The four-week average of continuing claims at 4.618M remained near the cycle low. This series dates back to 1966.
The above-mentioned decline in ongoing claims does not reflect those who receive extended benefits. Extended benefits for unemployment insurance rose sharply in the latest week to 394,380 and it was the highest level since November. These figures do not include the 4.995 mil. benefit recipients under state administered "EUC" emergency programs, but paid for by the Federal government.
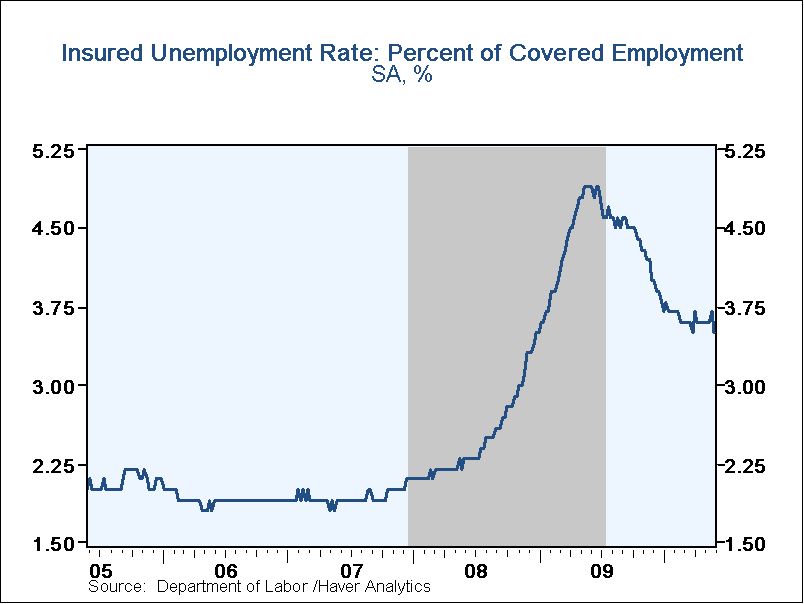
The insured unemployment rate dipped to 3.5% from an upwardly-revised 3.7%. The rate reached a high of 4.9% during May of 2009. During the last ten years, there has been a 96% correlation between the level of the insured unemployment rate and the overall rate of unemployment published by the Bureau of Labor Statistics.
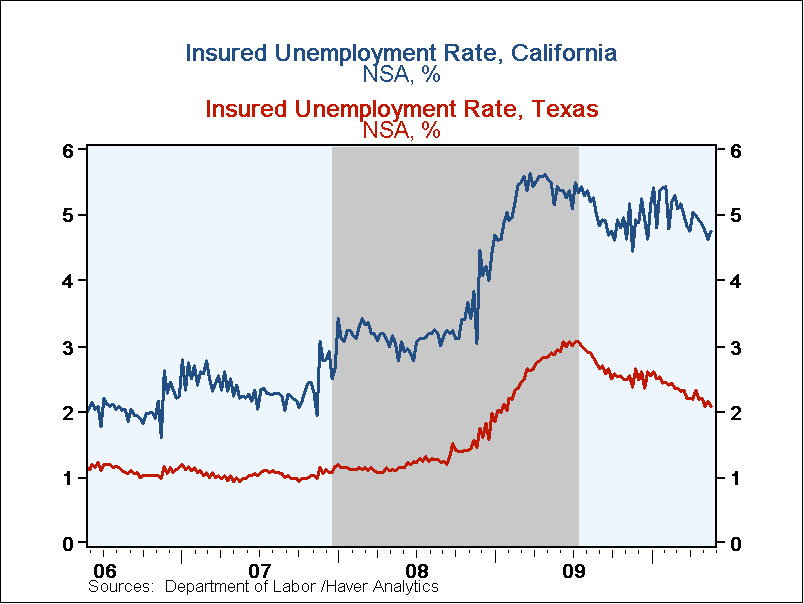
The highest insured unemployment rates in the week ending May 22 were in Puerto Rico (6.2 percent), Alaska (5.5), Oregon (5.3), California (4.8), Nevada (4.7), Pennsylvania (4.6), North Carolina (4.3), Wisconsin (4.2), Connecticut (4.1), New Jersey (4.0), and Rhode Island (4.0). The lowest insured unemployment rates were in Virginia (1.8), Texas (2.1), Tennessee (2.5), Wyoming (2.5), Georgia (2.9), Maryland (2.9), Ohio (2.9), Maine (2.9) Florida (3.0) and New York (3.2). These data are not seasonally adjusted but the overall insured unemployment rate is.
The unemployment insurance claims data is available in Haver's WEEKLY database and the state data is in the REGIONW database.
Fostering Workforce Development is yesterday's speech by Fed Chairman Ben S. Bernanke and it is available here.
| Unemployment Insurance (000s) | 06/04/10 | 05/28/10 | 05/21/10 | Y/Y | 2009 | 2008 | 2007 |
|---|---|---|---|---|---|---|---|
| Initial Claims | 456 | 459 | 463 | -233.6% | 572 | 419 | 321 |
| Continuing Claims | -- | 4,462 | 4,717 | -31.8 | 5,809 | 3,340 | 2,549 |
| Insured Unemployment Rate(%) | -- | 3.5 | 3.7 | 4.9 (6/2009) | 4.4 | 2.5 | 1.9 |
Carol Stone June 10, 2010
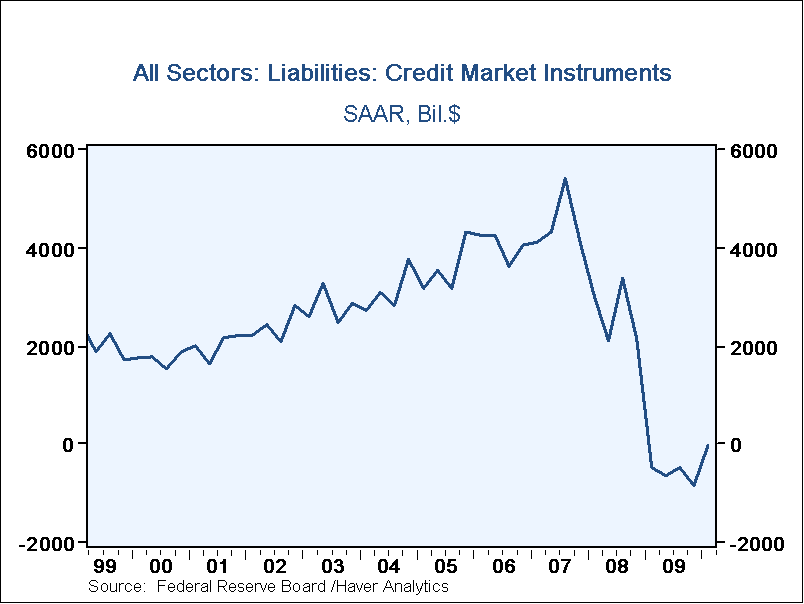
Activity in U.S. credit markets experienced a relative recovery in Q1, as total liabilities contracted a mere $10.3 billion, SAAR. This was a sharp improvement from the $841.3 billion rate of shrinkage in Q4 2009 and the year's average reduction of $610.6 billion. These debt aggregates come from the Federal Reserve's flow-of-funds statistics reported today, June 10, for Q1 2010.
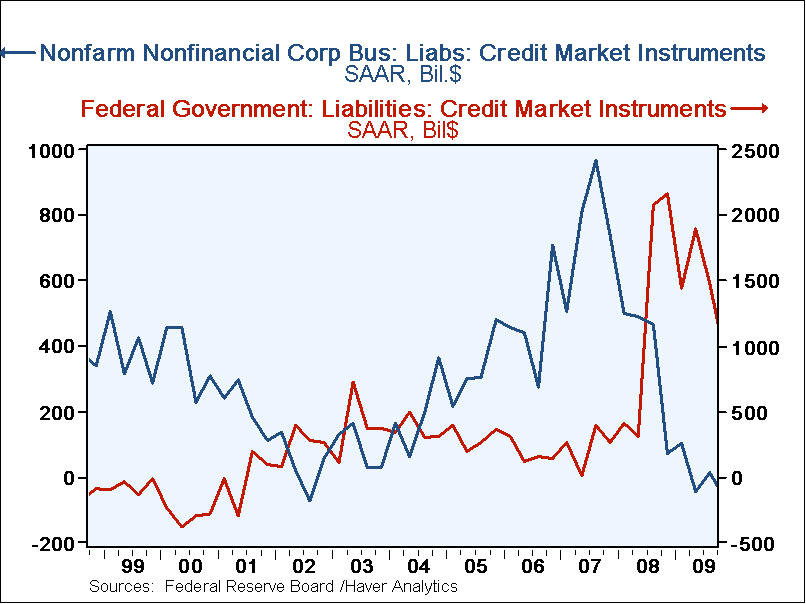
By sector, the biggest change was in nonfinancial corporations, which raised debt at a $289 billion annual rate, turning around from the net paydown of $57 billion in Q4. Companies had the largest amount of net commercial paper issuance since Q3 of 2008 and the largest volume of net new corporate bonds in a year. The federal government, as might be expected, increased its debt issuance from $956 billion in Q4 to $1,446 billion in Q1, both seasonally adjusted annual rates.
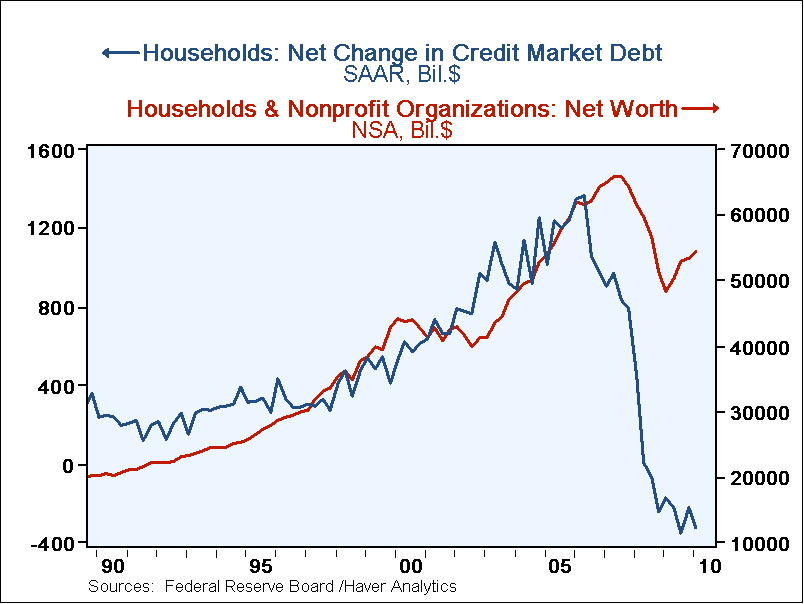
Households, on the other hand, continued paying down debt. Their home mortgage debt fell at a $390 billion rate and consumer credit at a $39 billion rate. With some partial offsets in other borrowing, their total credit usage dropped at a $330 billion pace. This contributed, as today's press reports have noted, to a further gain in their net worth to $54.6 trillion on March 31 from $53.5 trillion at year-end.
he financial sector extends its contraction. The debt of commercial banks, finance companies and specialized lenders fell at a $1,336 billion rate in Q1, a fifth consecutive quarterly drop, albeit the smallest. The largest was $2,293 billion in Q2 2009. Commercial banks and issuers of asset-backed securities (ABS) had the largest paydowns of their own debt among various financial institutions, and both of those, along with money market funds, also continued to reduce their provision of credit to their own customers.
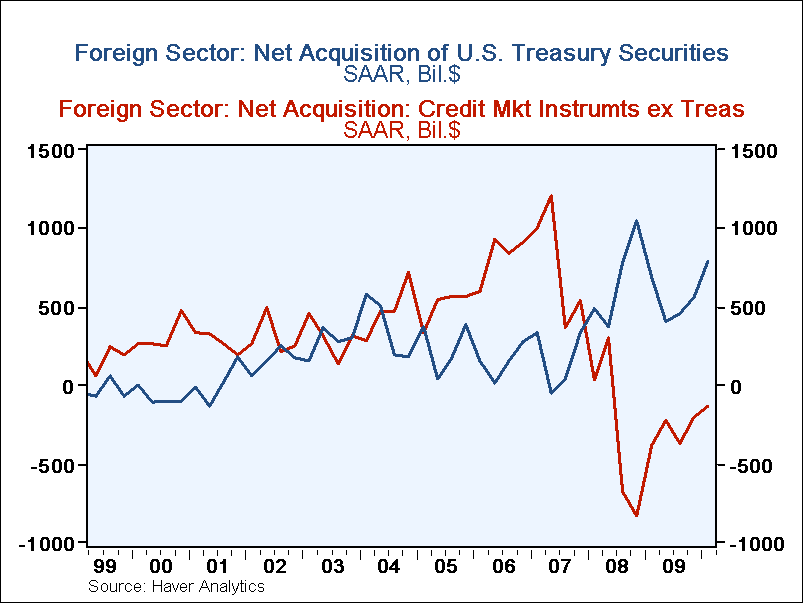
The rest of the world borrowed modestly in U.S. markets in Q1, $112 billion on balance. As investors, these foreign participants in U.S. financing provided $663 billion in total funds, more than accounted for by acquisition of Treasury securities: official holdings increased at a $451 billion annual rate and private foreign investors took on $339 billion worth. There were obviously liquidations of several other asset positions, especially including commercial paper and private holdings of agency and GSE-backed securities.
The flow-of-funds data are in Haver's FFUNDS database, and the series on Mortgage Equity Withdrawal are in USECON.
| Flow of Funds (Y/Y % Chg.) | % of Total Outstanding | Q1 '10 | 4Q '09 | 3Q '09 | End of Year | ||
|---|---|---|---|---|---|---|---|
| 2008 | 2007 | 2006 | |||||
| Total Credit Market Debt Outstanding | 100.0% | -1.5 | -0.5 | 0.7 | 5.1 | 10.3 | 9.9 |
| Federal Government | 15.9% | 21.3 | 22.7 | 30.1 | 24.2 | 4.9 | 3.9 |
| Households | 25.9% | -1.8 | -1.7 | -1.7 | 0.3 | 6.7 | 10.1 |
| Nonfinancial Corporate Business | 13.8% | 1.0 | 0.2 | 0.5 | 5.6 | 12.8 | 8.5 |
| Nonfarm, Noncorporate Business | 6.7% | -8.3 | -7.6 | -5.1 | 5.3 | 14.2 | 14.7 |
| Financial Sectors | 28.7% | -12.0 | -8.8 | -5.8 | 5.6 | 13.4 | 10.0 |
| Trillions of $ | |||||||
| Net Worth: Households & Nonprofit Organizations | -- | $54.565 | $53.502 | $52.974 | $51,293 | $64.358 | $64.415 |
| Tangible Assets: Households | -- | $22.994 | $23.061 | $23.081 | $23.890 | $28.037 | $29.735 |
| Financial Assets: Households | -- | $45.542 | $44.510 | $44.000 | $41.668 | $50.687 | $48.124 |
| Total Liabilities: Households | -- | $13.970 | $14.068 | $14.106 | $14.265 | $14.366 | $13.444 |
Tom Moeller June 10, 2010
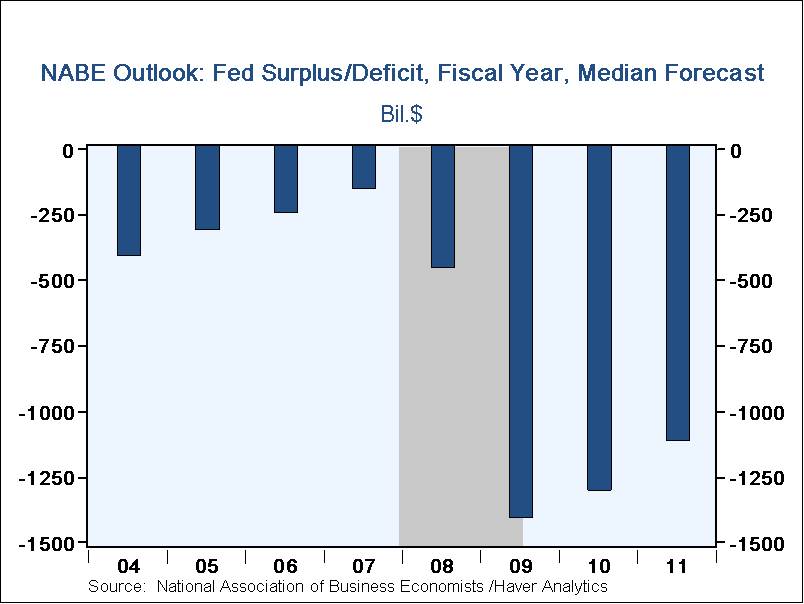 The Federal government ran
a budget deficit last month of $135.9B. The shortfall pulled the YTD
deficit to $935.6B but that was slightly diminished from the first
eight months of FY'09. The deficit's decline year-to-date is
in line with the latest projection from the Nat'l Association For
Business Economists of a diminished $1.310 trillion for 2010.
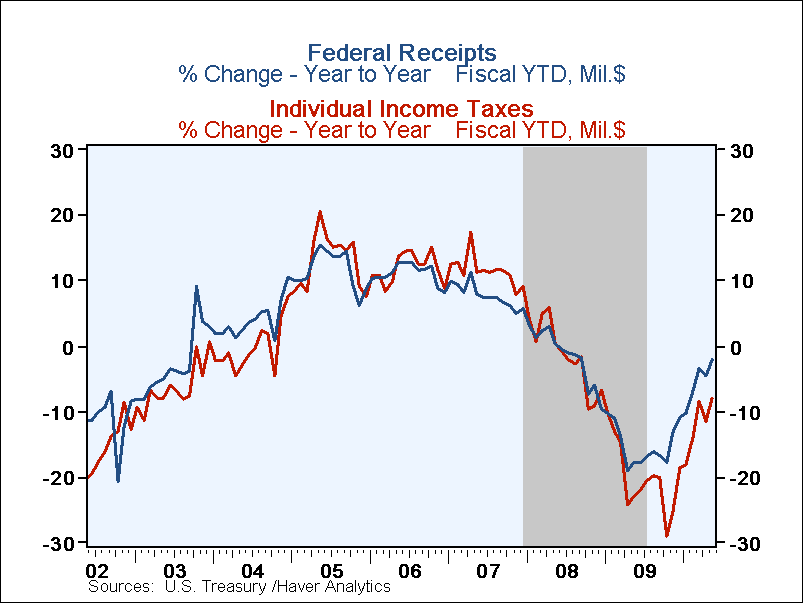
A slowing shortfall in net revenues during the first eight months of FY'10 helped ease the deficit. Individual income tax receipts fell 7.8% y/y as the unemployment rate remained elevated. The rate of decline, however, continued lower than the peak 29.0% at the end of last year. Corporate tax receipts rose 17.5% 'YTD versus the first eight months of last fiscal year with improved corporate profits, and the gain is accelerating. Year-to-date, employment taxes fell 4.4% (just lightly lower than the peak rate of decline) but unemployment insurance tax receipts improved by 13.4% versus the first eight months of last fiscal year. Estate & gift taxes fell by nearly one-quarter this fiscal year.
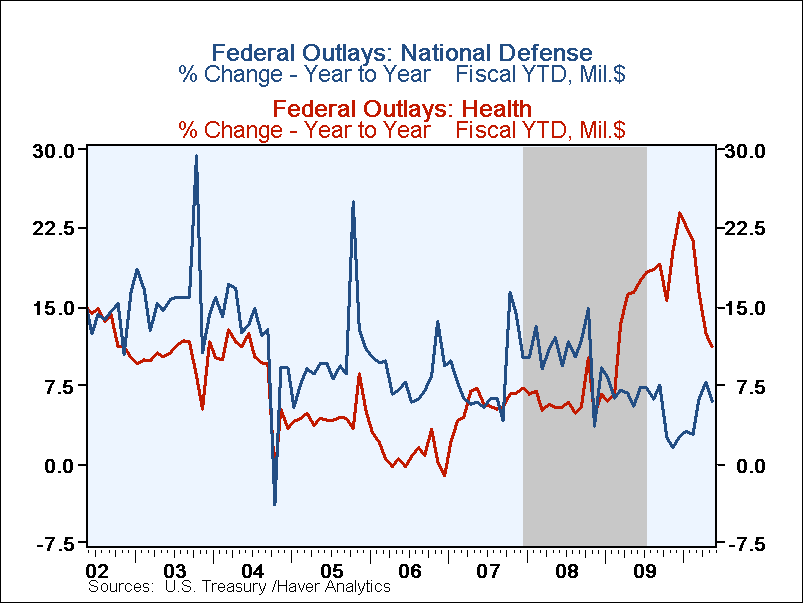
Overall, net outlays fell 3.5% so far this fiscal year versus FY'09 as a commerce & housing credit expired. "Income security" spending (11% of outlays) continued to jump by nearly one-quarter while defense spending (19% of total outlays) rose 6.1%. Social Security payments (21% of outlays) rose 3.3% and net interest payments (5% of outlays) rose 9.6%. Medicare expenditures (12% of outlays) rose 5.1% and other health care services spending (10% of outlays) rose 11.2%.
The Government's financial data are available in Haver's USECON database, with extensive detail available in the specialized GOVFIN.
Fix Double Leverage Problem from the American Enterprise Institute can be found here here.
| US Government Finance | May | FY 'YTD | FY 'YTD | FY 2009 | FY 2008 | FY 2007 |
|---|---|---|---|---|---|---|
| Budget Balance | $-135.9B | $-935.6B | -- | $-1,417.1B | $-454.8B | $-161.5B |
| Net Revenues | $146.8B | $1,346.0B | -2.0% | -16.6% | -1.7% | 6.7% |
| Net Outlays | $282.7B | $2,281.6B | -3.5% | 18.2% | 9.1% | 2.8% |
Tom Moeller
AuthorMore in Author Profile »Prior to joining Haver Analytics in 2000, Mr. Moeller worked as the Economist at Chancellor Capital Management from 1985 to 1999. There, he developed comprehensive economic forecasts and interpreted economic data for equity and fixed income portfolio managers. Also at Chancellor, Mr. Moeller worked as an equity analyst and was responsible for researching and rating companies in the economically sensitive automobile and housing industries for investment in Chancellor’s equity portfolio. Prior to joining Chancellor, Mr. Moeller was an Economist at Citibank from 1979 to 1984. He also analyzed pricing behavior in the metals industry for the Council on Wage and Price Stability in Washington, D.C. In 1999, Mr. Moeller received the award for most accurate forecast from the Forecasters' Club of New York. From 1990 to 1992 he was President of the New York Association for Business Economists. Mr. Moeller earned an M.B.A. in Finance from Fordham University, where he graduated in 1987. He holds a Bachelor of Arts in Economics from George Washington University.
More Economy in Brief
 Global| Feb 05 2026
Charts of the Week: Balanced Policy, Resilient Data and AI Narratives
by:Andrew Cates


