 Global| Mar 13 2009
U.S. Trade Deficit Shrinks ToLowest Since 2002
by:Tom Moeller
|in:Economy in Brief
Summary
January's U.S. foreign trade deficit narrowed again to its shallowest level since the summer of 2002. The deficit of $36.0B narrowed from the unrevised December figure of $39.0B. Lower oil prices and the U.S. recession acted to reduce [...]
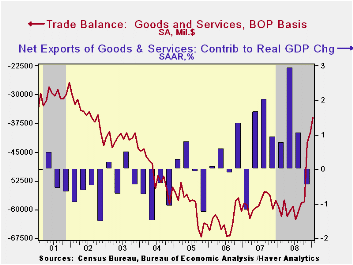 January's
U.S. foreign trade deficit narrowed again to its shallowest level since
the summer of 2002. The deficit of $36.0B narrowed from the
unrevised December figure of $39.0B. Lower oil prices and the U.S.
recession acted to reduce imports to their lowest level since 2005
while recessions abroad reduced exports to their lowest since mid-2006.
Consensus expectations had been for a January deficit of $38.0B.
January's
U.S. foreign trade deficit narrowed again to its shallowest level since
the summer of 2002. The deficit of $36.0B narrowed from the
unrevised December figure of $39.0B. Lower oil prices and the U.S.
recession acted to reduce imports to their lowest level since 2005
while recessions abroad reduced exports to their lowest since mid-2006.
Consensus expectations had been for a January deficit of $38.0B.
Adjusted for price inflation, the trade deficit in goods actually widened, primarily due to lower energy prices. The real trade deficit in goods increased versus December to its deepest since October. It has been roughly stable since last spring.
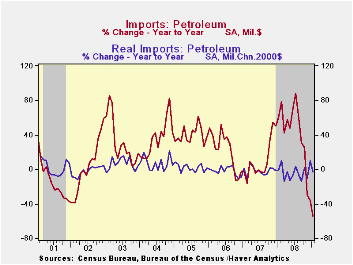
During January the 20.3% m/m decline in crude oil prices to an average $39.81 caused overall petroleum imports to drop by 18.4% to a level which was half what they were one year ago. In volume terms, however, petroleum imports slipped just 1.4% (-3.9% y/y) and they have been roughly flat since 2004.
Reflecting the U.S. recession, measured in chained-2000
dollars, nonoil
imports fell another 5.1% 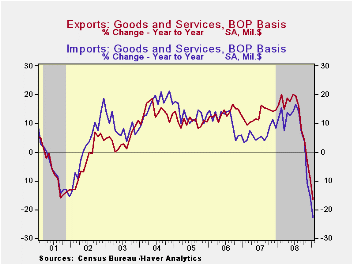 (-17.6% y/y) after similar declines during
the prior two months. The chained-dollar value of imports of automotive
vehicles & parts fell by nearly one quarter month-to-month and
they were down by nearly one half from their year ago level. Further
reflecting the U.S. recession was a 1.4% decline in real imports of
nonauto consumer goods (-10.2% y/y) to their lowest level since 2005.
Real imports of nonauto capital goods dropped by 6.0% (-16.1% y/y) for
their fourth consecutive monthly decline. These imports were at their
lowest since 2005.
(-17.6% y/y) after similar declines during
the prior two months. The chained-dollar value of imports of automotive
vehicles & parts fell by nearly one quarter month-to-month and
they were down by nearly one half from their year ago level. Further
reflecting the U.S. recession was a 1.4% decline in real imports of
nonauto consumer goods (-10.2% y/y) to their lowest level since 2005.
Real imports of nonauto capital goods dropped by 6.0% (-16.1% y/y) for
their fourth consecutive monthly decline. These imports were at their
lowest since 2005.
Services imports again were weak, down for the fifth consecutive month. The 1.9% decline brought them 4.4% below last year's level and reflected lower travel imports (-6.9% y/y). Passenger fares fell by 4.2% versus January of 2008.
Recessions abroad lowered real U.S. exports of goods for the fifth consecutive month. January's 8.6% decline (-17.8% y/y) dropped them to the lowest level since late-2005. The chained dollar value of capital goods exports declined 8.9% (-17.4% y/y) to their lowest level since late 2005. Exports of nonauto consumer goods also dropped hard. The 8.2% decline (-15.7% y/y) pulled them to their lowest since 2006. Real exports of automobiles & parts fell an even steeper 28.5% from December. They are off by half during the last year.
 Nominal
exports of services fell 2.4%
(-4.6% y/y) for the fourth drop in the last five months. Travel exports
were down 17.9% from their peak during August of last year while
passenger fares fell 16.8%.
Nominal
exports of services fell 2.4%
(-4.6% y/y) for the fourth drop in the last five months. Travel exports
were down 17.9% from their peak during August of last year while
passenger fares fell 16.8%.
The U.S. trade deficit in goods with China deepened slightly m/m to $20.6B. Exports to China fell 28.6% y/y while U.S. imports were off just 5.4%. The trade deficit with Japan narrowed sharply to $4.3B, its shallowest since 1997. Imports fell by nearly one third from last year while exports fell 22.8%.
The international trade data can be found in Haver's USECON database. Detailed figures are available in the USINT database.
| Foreign Trade | January | December | Y/Y | 2008 | 2007 | 2006 |
|---|---|---|---|---|---|---|
| U.S. Trade Deficit | $36.0B | $39.9B | $59.2B (01/08) | $681.1 | $700.3 | $753.3 |
| Exports - Goods & Services | -5.7% | -5.8% | -16.4% | 12.5% | 13.0% | 13.5% |
| Imports - Goods & Services | -6.7% | -5.8% | -22.8% | 7.3 | 6.1% | 10.8% |
| Petroleum | -18.5% | -6.7% | -54.0% | 37.0 | 9.4% | 20.1% |
| Nonpetroleum Goods | -6.0% | -6.4% | -18.0% | 1.3% | 4.8% | 9.1% |
by Tom Moeller March 13, 2009
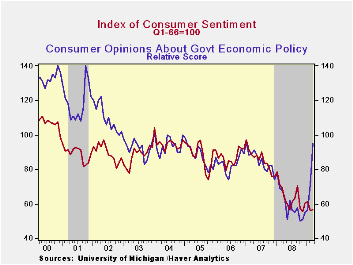
The earlier souring of consumers' moods seems to have stabilized. The University of Michigan reported that its reading of consumer sentiment held steady in early March with its February level. In fact, sentiment has moved roughly sideways since the summer, punctuated by a brief spike in the fall. Nevertheless the March reading of 56.6 was near the lowest since 1980. The latest figure was down 18.6% from last March but the reading came in slightly above Consensus expectations. During the last ten years, there has been a 62% correlation between the level of sentiment and the three-month change in real personal consumption expenditures.
The expectations component of consumer sentiment firmed a bit and recovered nearly half of the February decline. Expectations for business conditions during the next year led that increase but remained near the lowest level since 1980. Expectations for conditions during the next five years were about unchanged m/m. The expected change in personal finances also fell back to the lowest level since last June with a sharp 9.6% decline.
The current economic conditions index continued to move lower
and was down by one-quarter during the last twelve months. Buying
conditions for large household goods fell sharply to the lowest level
since last November and remained down 22.6% from a year earlier. The
view of current personal finances also fell and remained down by
one-half from early 2007.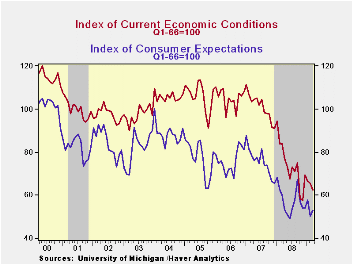
The opinion of government policy, which may eventually influence economic expectations, improved sharply to the highest level since January of 2007. Twenty three percent of respondents thought that a good job was being done by government, up from the four percent low of last December, while a much reduced twenty eight percent thought that a poor job was being done.
Inflation expectations for the next year were about stable at 2.4%. They were as high as 7.0% last May. The range of expectations is from slight price deflation to a 5.3% increase in prices. The expected inflation rate during the next five years reversed most of the increases during the last two months and fell to 2.9%.
The University of Michigan survey data is not seasonally adjusted. The reading is based on telephone interviews with about 500 households at month-end; the mid-month results are based on about 300 interviews. The summary indexes are in Haver's USECON database with details in the proprietary UMSCA database.
| University of Michigan | Mid-March | February | January | March y/y | 2008 | 2007 | 2006 |
|---|---|---|---|---|---|---|---|
| Consumer Sentiment | 56.6 | 56.3 | 61.2 | -18.6% | 63.8 | 85.6 | 87.3 |
| Current Conditions | 62.3 | 65.5 | 66.5 | -26.0 | 73.7 | 101.2 | 105.1 |
| Expectations | 53.0 | 50.5 | 57.8 | -11.8 | 57.3 | 75.6 | 75.9 |
by Tom Moeller March 13, 2009
U.S. import prices fell another 0.2% during February, dragged lower by the worldwide recession. The generalized decline, which offset the influence from higher oil prices, followed a little-revised 1.2% January drop. During the last twelve months, the 12.8% decline in import prices was the quickest in the series' history which dates back to 1983. February's figure fell short of Consensus expectations for a 0.7% drop.
Last month, petroleum prices firmed by 3.9%, reversing their January decline. This month, the average cost of $43.78 per barrel of Brent crude is even higher than the February level.
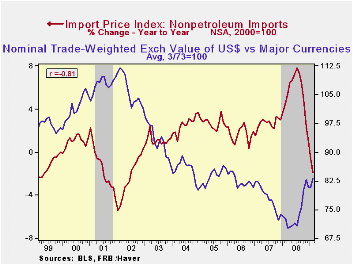
Offsetting that upturn in oil prices last month was a 0.6% drop in nonoil import prices. These prices have fallen during each of the last seven months and are down 6.3% during that period.
Through early March, the foreign exchange value of the dollar
rose 21.0% versus its year-ago level and further reduced the pressure
on U.S. import prices. During
the last ten years, there has been a negative 81% correlation between
the nominal trade-weighted exchange value of the US dollar vs. major
currencies and the y/y change in non-oil import prices.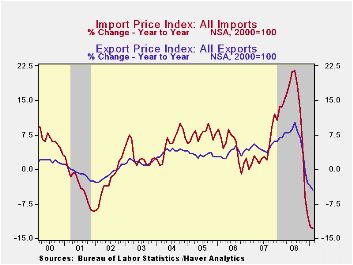
February capital goods import prices slipped 0.4%. On a three-month basis, prices fell at a 2.6% annual rate after 5%-to-6% rates of increase during early 2008. Excluding the lower prices of computers, prices of capital goods fell 0.3% in February. Three-month growth was 0.4% after a 4.3% increase during all of last year. Prices of computers, peripherals & accessories fell 0.7% last month and were down at a 9.4% rate during the last three months.
Prices for nonauto consumer goods were unchanged in February for the second consecutive month. The three-month rate of change remained a negative 0.8% versus the 5.9% peak rate of growth in early-2008. Durable consumer goods prices overall fell at a 4.7% annual rate during the last three months, a reversal from the 6.2% peak rate of increase in early 2008. Still moving higher, apparel prices rose 0.2% during February. The 2.0% three-month rate of growth was stable with apparel prices during all of last year. In a reversal, motor vehicle & parts prices rose at a 1.5% rate during the last three months following declines late in 2008.
Total export prices ticked 0.1% lower last month and at a 6.9% rate during the last three. Nonagricultural export prices rose 0.1% for the second month (-3.3% y/y), but agricultural prices fell 1.7% (-15.2% y/y).
The import and export price series can be found in Haver's USECON database. Detailed figures are available in the USINT database.
| Import/Export Prices (NSA, %) | February | January | Y/Y | 2008 | 2007 | 2006 |
|---|---|---|---|---|---|---|
| Import - All Commodities | -0.2 | -1.2 | -12.8 | 11.5 | 4.2 | 4.9 |
| Petroleum | 3.9 | -4.2 | -52.4 | 37.7 | 11.6 | 20.6 |
| Nonpetroleum | -0.6 | -0.8 | -1.9 | 5.3 | 2.7 | 1.7 |
| Export- All Commodities | -0.1 | 0.5 | -4.5 | 6.0 | 4.9 | 3.6 |
by Robert Brusca March 13, 2009
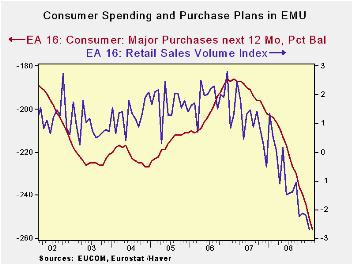
The E-Area consumer remains under pressure and the retail
sales picture reflects that. Even so, retailing is hardly the weakest
sector in the Area. The output sector – factories- are much weaker.
Exports are much weaker. Retail sales growth remains negative but the
three-month growth rate for sales shows less of a decline than for
six-months. The slowdown in retail sales actually is dissipating its
momentum even as European unemployment climbs and the recession
spreads. Since retail sales component data are not available through
the current month the trends for the components through December are
the most current: they show considerably more weakness.
Consumer sentiment is weak and falling across the Area. It
would be a surprise if there was much recovery for the consumer in the
coming months as unemployment continues to rise. Spending plans by
consumers (see chart) continue to be cut to extremely low levels.
European ‘stimulus plans have not been targeted at the consumer
although they could be expected to help provide some buffering.
| Jan-09 | Dec-08 | Nov-08 | 3-Mo | 6-MO | 12-Mo | |
| Zone-15 Total | 0.1% | -0.3% | -0.1% | -1.4% | -2.6% | -2.7% |
| Food | #N/A | -0.3% | -0.1% | -4.5% | -1.4% | -2.0% |
| Non-Food | #N/A | -0.4% | -0.4% | -7.1% | -2.5% | -2.5% |
| Textiles | #N/A | -0.6% | -0.6% | -16.0% | -2.8% | -3.0% |
| Books news, etc | #N/A | -0.5% | -1.9% | -11.8% | -5.2% | -4.4% |
| Pharma | #N/A | -0.1% | 0.1% | -2.2% | -0.4% | 0.2% |
| Other NonSpec | #N/A | -1.2% | 0.2% | -4.2% | -2.8% | -3.8% |
| Mail Order | #N/A | 3.9% | 0.0% | 8.0% | 9.4% | 3.4% |
| Country Detail; Volume | ||||||
| Germany: Volx Auto | -0.6% | 0.5% | 0.0% | -0.4% | 0.0% | -1.3% |
| Italy (Total; Value) | #N/A | 0.0% | -0.4% | -2.9% | -1.1% | -1.5% |
| UK (EU): Vol | 0.8% | 1.6% | 0.3% | 11.3% | 6.7% | 3.6% |
| Shaded areas calculated on a one-month lag due to lagging data | ||||||

Tom Moeller
AuthorMore in Author Profile »Prior to joining Haver Analytics in 2000, Mr. Moeller worked as the Economist at Chancellor Capital Management from 1985 to 1999. There, he developed comprehensive economic forecasts and interpreted economic data for equity and fixed income portfolio managers. Also at Chancellor, Mr. Moeller worked as an equity analyst and was responsible for researching and rating companies in the economically sensitive automobile and housing industries for investment in Chancellor’s equity portfolio. Prior to joining Chancellor, Mr. Moeller was an Economist at Citibank from 1979 to 1984. He also analyzed pricing behavior in the metals industry for the Council on Wage and Price Stability in Washington, D.C. In 1999, Mr. Moeller received the award for most accurate forecast from the Forecasters' Club of New York. From 1990 to 1992 he was President of the New York Association for Business Economists. Mr. Moeller earned an M.B.A. in Finance from Fordham University, where he graduated in 1987. He holds a Bachelor of Arts in Economics from George Washington University.
More Economy in Brief


