 Global| May 11 2005
U.S. Trade Deficit Posted Surprising Improvement
by:Tom Moeller
|in:Economy in Brief
Summary
The U.S. foreign trade deficit improved unexpectedly in March to $55.0B from the little revised record of $60.6B in February. Consensus expectations had been for a $61.5B deficit. Total exports jumped 1.5% following two months of [...]
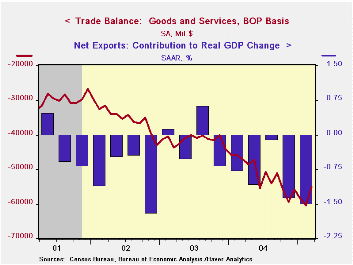
The U.S. foreign trade deficit improved unexpectedly in March to $55.0B from the little revised record of $60.6B in February. Consensus expectations had been for a $61.5B deficit.
Total exports jumped 1.5% following two months of little change. Goods exports surged 1.4% (6.9% y/y) on the strength of a 6.6% increase in foods, feeds & beverages and a 3.3% (4.7% y/y) rise in capital goods. Exports of advanced technology products jumped 31.3% (NSA, +2.9% y/y).
In other categories export performance paled. Exports of non-auto consumer goods were unchanged (9.8% y/y) after a 3.1% spike in February and automotive exports fell 1.2% (+7.0% y/y), down for the second month.
Services exports rose 1.8% (7.7% y/y) as passenger fares jumped 3.9% 14.5% y/y) and spending on travel surged 2.8% (10.8% y/y).
Total imports slumped 2.5% despite a 4.1% (32.4% y/y) rise in petroleum products. The average price of crude oil surged 11.6% to $41.14 per bbl. (34.3% y/y). Imports of non-petroleum goods fell 4.6% (+4.7% y/y) as capital goods imports fell 1.1% (+8.3% y/y) for the second monthly decline and nonauto consumer goods imports plunged 6.8% (+4.5% y/y).
The US trade deficit with China improved for the second month to $12.9B ($162.0B in 2004) as exports surged (-2.0% y/y) and imports fell (+17.4% y/y). The US trade deficit with Japan deepened further to $7.8B ($75.2B in 2004) but the monthly trade deficit with the Asian NICs nearly dissolved ($21.9B in 2004) due to a 22.1% surge in exports (3.8% y/y). The US trade deficit with the European Union deepened to $9.3B ($110.0B in 2004), the result of an 11.7% jump in imports (+1.0% y/y) which outpaced a 12.7% (4.8% y/y) rise in exports.
Are We Underestimating the Gains from Globalization for the United States? from the Federal Reserve Bank of New York is available here.
The Evolution and Implications of the U.S. Current Account Deficit from the Federal Reserve Bank of Atlanta can be found here.
Unwinding the Current Account Deficit from the Federal Reserve Bank of St. Louis can be viewed here.
| Foreign Trade | Mar | Feb | Y/Y | 2004 | 2003 | 2002 |
|---|---|---|---|---|---|---|
| Trade Deficit | $55.0.0B | $60.6B | $47.1B (3/04) | $617.1B | $496.5B | $421.7B |
| Exports - Goods & Services | 1.5% | 0.2% | 7.1% | 12.4% | 4.6% | -3.1% |
| Imports - Goods & Services | -2.5% | 1.5% | 10.3% | 16.3% | 8.5% | 2.1% |

Tom Moeller
AuthorMore in Author Profile »Prior to joining Haver Analytics in 2000, Mr. Moeller worked as the Economist at Chancellor Capital Management from 1985 to 1999. There, he developed comprehensive economic forecasts and interpreted economic data for equity and fixed income portfolio managers. Also at Chancellor, Mr. Moeller worked as an equity analyst and was responsible for researching and rating companies in the economically sensitive automobile and housing industries for investment in Chancellor’s equity portfolio. Prior to joining Chancellor, Mr. Moeller was an Economist at Citibank from 1979 to 1984. He also analyzed pricing behavior in the metals industry for the Council on Wage and Price Stability in Washington, D.C. In 1999, Mr. Moeller received the award for most accurate forecast from the Forecasters' Club of New York. From 1990 to 1992 he was President of the New York Association for Business Economists. Mr. Moeller earned an M.B.A. in Finance from Fordham University, where he graduated in 1987. He holds a Bachelor of Arts in Economics from George Washington University.
More Economy in Brief


