 Global| Jan 13 2009
U.S. Trade Deficit NarrowedSharply With Recession and Lower Oil Prices
by:Tom Moeller
|in:Economy in Brief
Summary
The U.S. foreign trade deficit narrowed sharply during November as the U.S. recession and lower oil prices combined to reduce imports. The sharp drop to $40.4B from a revised $56.7B during October was much greater than Consensus [...]
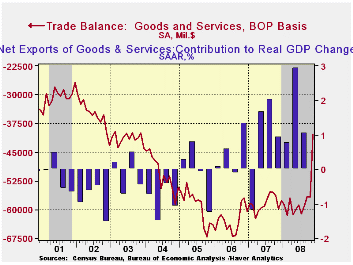
The U.S. foreign trade deficit narrowed sharply during November as the U.S. recession and lower oil prices combined to reduce imports. The sharp drop to $40.4B from a revised $56.7B during October was much greater than Consensus expectations for a narrowing to $51.0B. So far this year the monthly trade deficit has averaged $57.4B, narrower than the $58.4B averaged during the first eleven months of 2007.
Adjusted for price inflation the trade deficit in goods
narrowed to $39.5B from a revised October level of $45.6B. Year-to-date
the real deficit narrowed more than $10.0B versus 2007 to an average
$44.3B as real exports rose 8.0% and real imports fell 3.0%.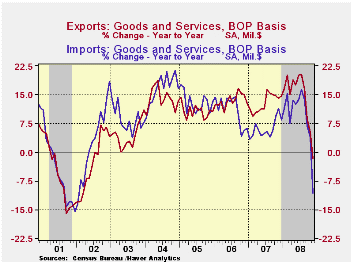
Lower oil prices caused November petroleum imports to drop by more than one-third month-to-month and the U.S. recession lowered nonoil imports by 7.8%. In volume terms, nonoil imports fell 6.0% (-10.7% y/y) during November. The quantity of petroleum products imported dropped 10.0% (-11.6% y/y). The quantity of crude petroleum imports declined 16.6% (-12.9% y/y) to nearly the lowest level since early 2003. The average price per barrel of crude oil halved to $66.72 (-16.5% y/y) from a high of $124.7 in July.
The value of nonpetroleum imports fell by 7.8%. Measured in chained 2000 dollars, nonoil imports fell 6.0% (-10.7% y/y). Reflecting the weakness in consumer spending were real imports of nonauto consumer goods which fell 9.1% (-11.4% y/y) to their lowest level since early 2006. The chained-dollar value of imports of automotive vehicles & parts fell another 6.3% (-26.9% y/y) and real imports of nonauto capital goods dropped 5.6% (-7.9% y/y).
Services imports fell 2.3% (+3.6% y/y). Travel imports fell a
sharp 2.9% (-1.7% y/y) while passenger fares were off 2.8% m/m but
nevertheless rose 9.4% y/y). That annual gain is less than half what it
was earlier this year.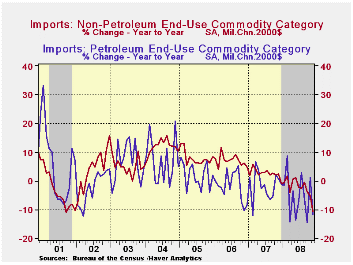
Recessions abroad lowered U.S. exports for the fourth consecutive month. Moreover, the 5.8% decline was near the largest since 2001. The decline reflected a sharp 7.2% drop in goods exports following a 2.8% shortfall during October. Adjusted for prices, chained-dollar goods exports fell 3.3% (-2.5% y/y). Real exports of capital goods declined 3.6% (-6.7% y/y) for the third consecutive monthly drop, a period during which these exports have fallen 13.5%. Exports of nonauto consumer goods slipped 0.6%, off 5.9% during the last three months and real exports of automobiles & parts fell 10.9% (-18.0% y/y).
Nominal exports of services fell 2.5% (+3.0% y/y). Travel exports fell hard for the third straight month. The 3.7% decline reflected lower passenger fares which fell 4.3%. They remained up 6.0% y/y after 16.1% growth last year. Exports of "other" private services fell 2.1% dropping the year-to-year growth to 2.4% after an 18.2% gain during all of last year.
The U.S. trade deficit in goods with China narrowed to $23.1B, the smallest since June. Exports to China reversed all of the October gain and fell 14.0% (-10.7% y/y). Imports fell a hard 16.9% (-5.0% y/y) due to the U.S. recession. The trade deficit with Japan narrowed m/m to $5.0B which was near the shallowest since 2003. So far this year the deficit has dropped to $6.1B from an average $6.9B during the first eleven months of last year.
The Crisis and the Policy Response is today's speech by Fed Chairman Ben S. Bernanke and it can be found here.
Beyond Shocks: What Causes Business Cycles? An Overview is a 1998 study from the Federal Reserve Bank of Boston and it is available here.
| Foreign Trade | November | October | Y/Y | 2007 | 2006 | 2005 |
|---|---|---|---|---|---|---|
| U.S. Trade Deficit | $40.4 | $56.7B | $60.0B (11/07) | $700.3 | $753.3 | $711.6B |
| Exports - Goods & Services | -5.8% | -2.3% | -1.7% | 13.0% | 13.5% | 10.6% |
| Imports - Goods & Services | -12.0% | -1.6% | -10.6% | 6.1% | 10.8% | 12.8% |
| Petroleum | -36.5% | 1.8% | -30.3% | 9.4% | 20.1% | 39.6% |
| Nonpetroleum Goods | -7.8% | -2.5% | -9.3% | 4.8% | 9.1% | 10.3% |
Economy Watchers Index Drops Sharply
by Robert Brusca January 13, 2009
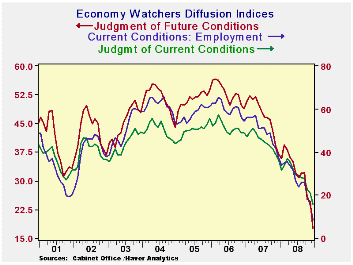
Japan’s economy watcher’s index falls sharply in December. It
is at its weakest point in five years and longer. The employment
component is very weak as is the future index. The future index is
barley higher than the very weak current index.
Economic trends in the Teikoku survey are similarly weak
across sectors. Both surveys show another sharp drop off in December
compared to an already very weak November. These surveys echo the
measure from the OECD Leading indicators just released yesterday (for
November) that Japan’s slowdown is becoming more pronounced.
| Key Japanese Surveys | |||||||
|---|---|---|---|---|---|---|---|
| Raw readings of each survey | Percent of 5Yr range* | ||||||
| Dec-08 | Nov-08 | Oct-08 | Sep-08 | Dec-08 | Nov-08 | Oct-08 | |
| Diffusion | - | - | - | - | - | - | - |
| Economy Watchers | 15.9 | 21.0 | 22.6 | 28.0 | 0.0% | 0.0% | 0.0% |
| Employment | 8.5 | 15.7 | 19.6 | 25.9 | 0.0% | 0.0% | 0.0% |
| Future | 17.6 | 24.7 | 25.2 | 32.1 | 0.0% | 0.0% | 0.0% |
| Econ Trends (Teikoku'/50 neutral/weighted diffusion) | |||||||
| MFG | 19.3 | 24.5 | 27.4 | 30.9 | 0.0% | 0.0% | 0.0% |
| Retail | 21.3 | 24.4 | 25.2 | 27.8 | 0.0% | 0.0% | 0.0% |
| Wholesale | 20.4 | 24.7 | 26.4 | 29.1 | 0.0% | 0.0% | 0.0% |
| Services | 24.1 | 28.4 | 29.9 | 32.4 | 0.0% | 0.0% | 0.0% |
| Construction | 19.1 | 21.4 | 22.5 | 24.3 | 0.0% | 0.0% | 0.0% |
U.S. Gasoline Prices Again Moved Higher
by Tom Moeller January 13, 2009
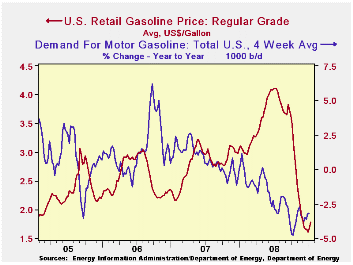
Regular gasoline prices again moved higher last week. They rose ten cents to an average $1.78 per gallon after the prior week's seven cent gain, according to the U.S. Department of Energy survey. Nevertheless, the price was still down from $2.75 for all of November. Yesterday, the spot market price for a gallon of regular gasoline fell slightly to $1.05 per gallon which was off ten cents from last week's highs.
Weekly gasoline prices can be found in Haver's WEEKLY
database. Daily prices are in the DAILY
database.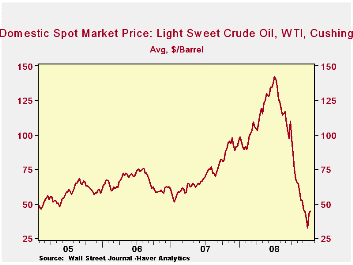
Product demand continues to fall despite lower prices, pulled down by the developing economic recession. The U.S. Department of Energy reported that the demand for gasoline fell by 2.1% for all of last year versus 2007. The figures for the latest four weeks fell 3.2% y/y, nearly the fastest rate of decline since late-1995 (the latest four weeks versus the same four weeks in 2007). The demand for all petroleum products also fell 2.9% y/y. These numbers are available in Haver's OILWKLY database.
The source for that reduced demand for gasoline is the cutback
in vehicle miles driven which have fallen 3.5% during the twelve months
ended October. The decline of roughly this magnitude, sustained as it
has been for most of last year, is unprecedented. These Department of
Transportation figures are available in Haver's OGJ database.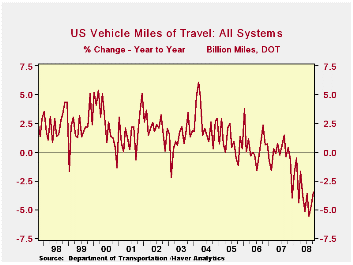
Another source for the drop in gasoline demand is the 24.9% decline in light truck sales for all of last year versus 2007. That exceeded the 10.8% decline in U.S. car sales. Sales of the relatively fuel efficient light trucks made by Toyota, Nissan and Honda fell 22.3%, 17.2% and 16.9% respectively while sales of General Motors light trucks fell 28.1% for the full year versus 2007 and Ford truck sales fell 25.8%. These figures are available in Haver's INDUSTRY statistics database.
The price for a barrel of West Texas Intermediate crude oil also moved higher last week to $44.51 per barrel, the highest level in four weeks. Prices reached their high of $145.66 last July. In futures trading yesterday, the one-month price for crude oil was $40.83.
Last week, prices for natural gas rose for the second week and reached $5.85 per mmbtu (-25.3% y/y). The latest average price was almost 50% below natural gas prices in early-July of $13.19/mmbtu.
U.S. Monetary Policy Objectives in the Short and Long Run is adapted from a recent speech given by Janet L. Yellen, President and CEO of the Federal Reserve Bank of San Francisco, and it can be found here.
| Weekly Prices | 01/12/09 | 01/05/09 | Y/Y | 2008 | 2007 | 2006 |
|---|---|---|---|---|---|---|
| Retail Regular Gasoline ($ per Gallon) | 1.78 | 1.68 | -41.9% | 3.25 | 2.80 | 2.57 |
| Light Sweet Crude Oil, WTI ($ per bbl.) | 44.51 | 42.50 | -53.0% | 100.16 | 72.25 | 66.12 |
U.S. Small Business Optimism Fell Further to Near All-time Low; Pricing At All-time Low
by Tom Moeller January 13, 2009
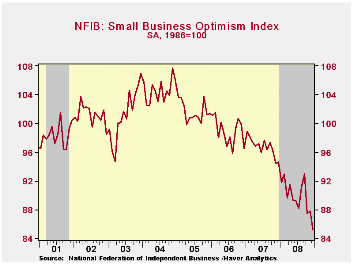
According to the National Federation of Independent Business (NFIB), small business optimism fell hard last month. The index level of 85.2 was down 3.0% month-to-month and it followed the slight 0.3% November uptick. The latest was the lowest since early 1980 and it was the second lowest level on record.
During the last ten years there has been a 49% correlation between the level of the NFIB index and the two-quarter change in real GDP.
The percentage of firms planning to raise prices fell to 3%, the lowest on record. The percentage of firms actually raising prices fell into negative territory and the reading was the lowest since early 2002. During the last ten years there has been a 69% correlation between the y/y change in the producer price index and the level of the NFIB price index.
The percentage expecting the economy to improve fell to near
the lows of earlier this year. The percentage reporting that now is a
good time to expand the business was stable at 7%, near the lowest
since 2003. During the next 3-6 months, plans for capital spending
dropped sharply to near the lowest level since 1975.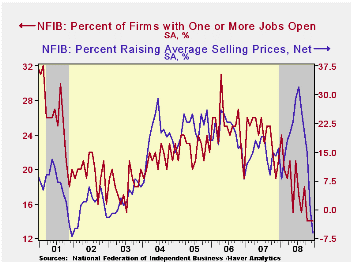
The percentage planning to raise employment fell further into negative territory while the percentage of respondents with one or more job openings remained at 14%, the least since 1992. During the last ten years there has been a 71% correlation between the NFIB employment percentage and the y/y change in nonfarm payrolls.
The percent expecting credit conditions to ease fell slightly and remained near its lowest level since 1980. The percent expecting higher real sales in six months fell to near the lowest since 1980.
The largest, single most important problems seen by business were poor sales (27%), taxes (20%), inflation (7%), insurance cost and availability (10%) and government requirements (8%).
About 24 million businesses exist in the United States. Small business creates 80% of all new jobs in America.
The NFIB figures can be found in Haver's SURVEYS database.
| Nat'l Federation of Independent Business | December | November | Y/Y | 2008 | 2007 | 2006 |
|---|---|---|---|---|---|---|
| Small Business Optimism Index (SA, 1986=100) | 85.2 | 87.8 | -9.9% | 89.8 | 96.7 | 98.9 |
JOLTS: U.S. Job Openings Lowest Since 2003
by Tom Moeller January 13, 2009
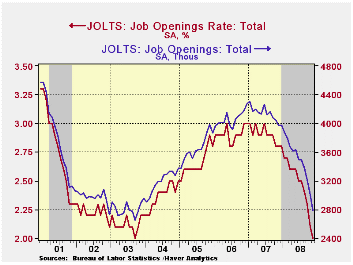
The Bureau of Labor Statistics indicated in its November Job Openings & Labor Turnover Survey (JOLTS) report that the number of job openings fell 6.9% from October and by nearly one third from November 2007. The latest level was the lowest since October 2003. Since their peak in January of 2007 the number of job openings have fallen 35.2%.
The job openings rate also fell. The August rate was down to 2.3% versus an upwardly revised 2.5% in July. The latest figures are down from near 3% one year ago. The job openings rate is the number of job openings on the last business day of the month as a percent of total employment plus job openings.
The actual number of job openings in the construction and
manufacturing sectors halved versus November of 2007. Professional & business
services job openings fell by one third year-to-year while openings in
the education & health sectors also were weak and they fell
17.0%. Openings in retail trade rose 11.9% y/y.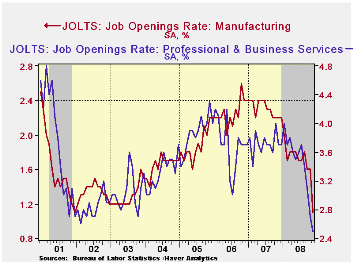
By region, openings in the South were off by one third while they fell by one quarter in the Midwest. In the West openings fell 30.7% and in the Northeast they were down 19.6%.
The hires rate fell to 2.6% which was the lowest in the series' short eight year history.The hires rate is the number of hires during the month divided by employment.The actual number of hires fell by nearly one quarter year-to-year and no sector showed any strength. Hires in the construction sector were off by nearly one third. In the factory sector hires fell 38.8% y/y and in the professional & business services sector they fell 20.3%. In the leisure and hospitality sector hires fell 31.6% y/y while hires in the educational & health sector fell 16.9%.
The job separations rate rose just slightly to 3.6% but remained down versus last year. Separations include quits, layoffs, discharges, and other separations as well as retirements. The level of job separations fell 3.5% y/y.
The JOLTS survey dates only to December 2000 but has since followed the movement in nonfarm payrolls, though the actual correlation between the two series is low.
A description of the Jolts survey and the latest release from the U.S. Department of Labor is available here and the figures are available in Haver's USECON database.
| JOLTS (Job Openings & Labor Turnover Survey) | November | October | November '07 | 2007 | 2006 | 2005 |
|---|---|---|---|---|---|---|
| Job Openings, Total | ||||||
| Rate (%) | 2.0 | 2.1 | 2.8 | 2.8 | 3.0 | 2.8 |
| Total (000s) | 2,793 | 3,001 | 3,972 | 3,974 | 4,272 | 3,863 |
| Hires, Total | ||||||
| Rate (%) | 2.6 | 3.0 | 3.5 | 41.9 | 43.4 | 43.1 |
| Total (000s) | 3,548 | 4,155 | 4,672 | 57,771 | 59,153 | 57,501 |
U.S. Budget Deficit Continued To Swell Toward A Record
by Tom Moeller January 13, 2009
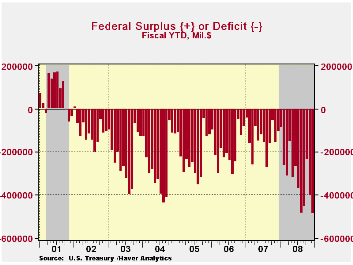
The U.S. government's budget deficit for December continued to reflect the combined effects of a U.S. recession as well as wars in Iraq and Afghanistan.The monthly deficit rose to $83.6 billion. While not large, it compares to a usual budget surplus for December. For the first quarter of this fiscal year the government's budget deficit totaled $485.2B, four times that of last fiscal year's first quarter. Consensus projections were for a December deficit of $63.8B.
Many forecasts for the budget deficit during all of this
fiscal year are near $700B. If realized, that would swell the deficit
to about 5% of GDP following last year's roughly 3.2% and FY07's
marginal 1.2%.The recent estimate from the Congressional Budget Office
is for a much higher deficit this year of $1.2 trillion, or 8.3% of GDP.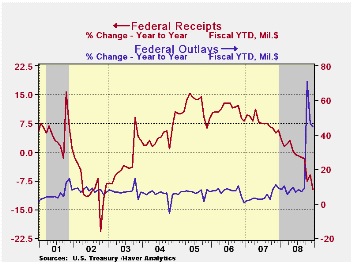
Net revenues during December fell 14.1% from last year and for the first fiscal quarter were down 9.7%. Individual income tax receipts reflected lower employment levels and for 1Q fell 6.7% year-to-year. Corporate tax receipts were hit even harder and they fell 45.6%. Growth in unemployment and social insurance taxes grew just 0.9%, the least since late 2003.
U.S. government outlays surged by nearly one-half from last year's first fiscal quarter. Defense spending (19% of total outlays) rose 9.9%. The gain does not reflect the full cost of the resources devoted to Iraq & Afghanistan since much of the spending would have occurred anyway. Medicare expenditures (12% of outlays) rose by 13.1% and social security spending (21% of outlays) rose 5.5% after 6.8% growth last year. "Income security" payments jumped 18.1% but net interest payments fell 11.8% y/y with lower interest rates.
The Budget and Economic Outlook: Fiscal Years 2009 to 2019 from the Congressional Budget Office can be found here.
The Government's financial data are available in Haver's USECON database, with extensive detail available in the specialized GOVFIN.
| US Government Finance | December | November | Y/Y | FY 2008 | FY 2007 | FY 2006 |
|---|---|---|---|---|---|---|
| Budget Balance | -$83.6B | $-164.4B | $48.3B (12/07) |
-$454.8B | -$161.5B | -$248.2B |
| Net Revenues | $237.8B | $144.8B | -14.1% | -1.7% | 6.7% | 11.8% |
| Net Outlays | $321.4B | $309.2B | 40.5% | 9.1% | 2.8% | 7.4% |
Grim News from the UK
by Louise Curley January 13, 2009
The British Chamber of Commerce's economic survey conducted in
the fourth quarter of 2008 showed an economy losing ground at an
alarming rate. The survey collects the opinions of manufacturers and
service providers on the state of a wide variety of key business
indicators--domestic and export sales, domestic and export orders,
prices, employment, capacity utilization and cash flow--and on their
confidence in future sales, capital expenditure plans and
profitability. The results are expressed in percent balances--the
percent of respondents reporting an increase less the percent reporting
a decrease. The responses in the fourth quarter were almost universally
negative and many at record lows.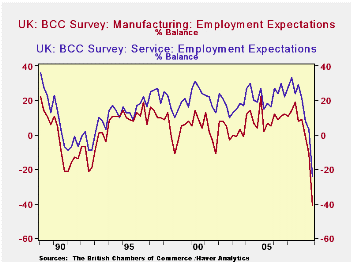
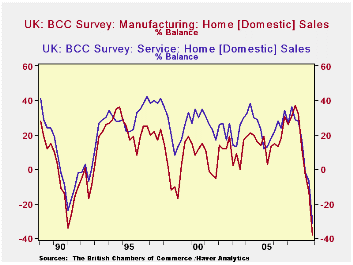
The table below shows the deterioration in domestic and export sales, employment expectations, plans for expansion and profitability expectations since mid 2007 when the sub prime mortgage crisis in the United States exposed the fragility of the financial system, not only in the U. S. but worldwide. In the year and a half since then, the balance of opinion of manufacturers regarding their domestic sales, for example, has gone from +37% to -38%.
 The three charts put the recent declines in domestic sales,
expectations of employment and of profitability in perspective. The
first shows that fourth quarter domestic sales of manufacturers and
service providers were about as low as they were in recession of the
early 90's. Expectations of employment in the fourth quarter, shown in
the second chart, were below those of the earlier recession and the
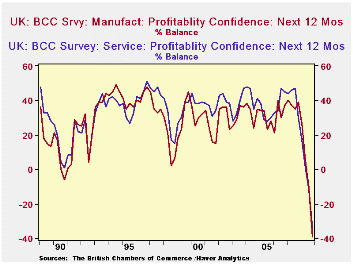
lowest so far recorded. The fourth quarter balances for expectations of
profitability, -39% and -34%, respectively for manufacturers and
service providers, shown in the third chart, compare with balances of
-6% and 1%, respectively, in the recession of the early 90's.
The three charts put the recent declines in domestic sales,
expectations of employment and of profitability in perspective. The
first shows that fourth quarter domestic sales of manufacturers and
service providers were about as low as they were in recession of the
early 90's. Expectations of employment in the fourth quarter, shown in
the second chart, were below those of the earlier recession and the
lowest so far recorded. The fourth quarter balances for expectations of
profitability, -39% and -34%, respectively for manufacturers and
service providers, shown in the third chart, compare with balances of
-6% and 1%, respectively, in the recession of the early 90's.
| BRITISH CHAMBER OF COMMERCE SURVEY (% Balance) | Q4 08 | Q3 08 | Q2 08 | Q1 08 | Q4 07 | Q3 07 |
|---|---|---|---|---|---|---|
| Domestic Sales -- Manufacturing | -38 | -13 | -3 | 12 | 32 | 37 |
| Domestic Sales -- Services | -31 | -7 | -2 | 17 | 28 | 29 |
| Export Sales -- Manufacturing | -12 | -3 | 28 | 16 | 22 | 31 |
| Export Sales -- Services | -9 | 13 | 9 | 17 | 15 | 25 |
| Employment Expectations (3 mo ahead) -- Mfg | -17 | 0 | 3 | 9 | 11 | 20 |
| Employment Expectations (3 mo ahead) -- Services | -22 | 2 | 7 | 16 | 17 | 21 |
| Plans for Expansion -- Manufacturing | -22 | -4 | 2 | 12 | 21 | 33 |
| Plans for Expansion -- Services | -27 | -2 | 5 | 8 | 14 | 17 |
| Profitability Expectations (12 mo ahead) -- Mfg | -38 | -11 | 5 | 27 | 39 | 35 |
| Profitability Expectations (12 mo ahead) -- Services | -34 | -12 | 1 | 17 | 30 | 47 |

Tom Moeller
AuthorMore in Author Profile »Prior to joining Haver Analytics in 2000, Mr. Moeller worked as the Economist at Chancellor Capital Management from 1985 to 1999. There, he developed comprehensive economic forecasts and interpreted economic data for equity and fixed income portfolio managers. Also at Chancellor, Mr. Moeller worked as an equity analyst and was responsible for researching and rating companies in the economically sensitive automobile and housing industries for investment in Chancellor’s equity portfolio. Prior to joining Chancellor, Mr. Moeller was an Economist at Citibank from 1979 to 1984. He also analyzed pricing behavior in the metals industry for the Council on Wage and Price Stability in Washington, D.C. In 1999, Mr. Moeller received the award for most accurate forecast from the Forecasters' Club of New York. From 1990 to 1992 he was President of the New York Association for Business Economists. Mr. Moeller earned an M.B.A. in Finance from Fordham University, where he graduated in 1987. He holds a Bachelor of Arts in Economics from George Washington University.
More Economy in Brief


