 Global| Jan 13 2009
U.S. Trade Deficit Narrowed Sharply With Recession and Lower Oil Prices
by:Tom Moeller
|in:Economy in Brief
Summary
The U.S. foreign trade deficit narrowed sharply during November as the U.S. recession and lower oil prices combined to reduce imports. The sharp drop to $40.4B from a revised $56.7B during October was much greater than Consensus [...]
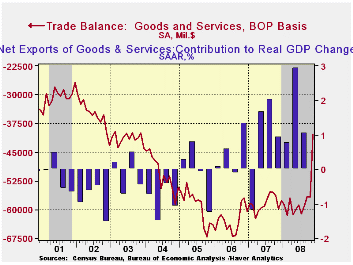
The U.S. foreign trade deficit narrowed sharply during November as the U.S. recession and lower oil prices combined to reduce imports. The sharp drop to $40.4B from a revised $56.7B during October was much greater than Consensus expectations for a narrowing to $51.0B. So far this year the monthly trade deficit has averaged $57.4B, narrower than the $58.4B averaged during the first eleven months of 2007.
Adjusted for price inflation the trade deficit in goods narrowed to $39.5B from a revised October level of $45.6B. Year-to-date the real deficit narrowed more than $10.0B versus 2007 to an average $44.3B as real exports rose 8.0% and real imports fell 3.0%.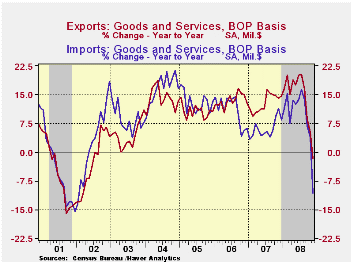
Lower oil prices caused November petroleum imports to drop by more than one-third month-to-month and the U.S. recession lowered nonoil imports by 7.8%. In volume terms, nonoil imports fell 6.0% (-10.7% y/y) during November. The quantity of petroleum products imported dropped 10.0% (-11.6% y/y). The quantity of crude petroleum imports declined 16.6% (-12.9% y/y) to nearly the lowest level since early 2003. The average price per barrel of crude oil halved to $66.72 (-16.5% y/y) from a high of $124.7 in July.
The value of nonpetroleum imports fell by 7.8%. Measured in chained 2000 dollars, nonoil imports fell 6.0% (-10.7% y/y). Reflecting the weakness in consumer spending were real imports of nonauto consumer goods which fell 9.1% (-11.4% y/y) to their lowest level since early 2006. The chained-dollar value of imports of automotive vehicles & parts fell another 6.3% (-26.9% y/y) and real imports of nonauto capital goods dropped 5.6% (-7.9% y/y).
Services imports fell 2.3% (+3.6% y/y). Travel imports fell a sharp 2.9% (-1.7% y/y) while passenger fares were off 2.8% m/m but nevertheless rose 9.4% y/y). That annual gain is less than half what it was earlier this year.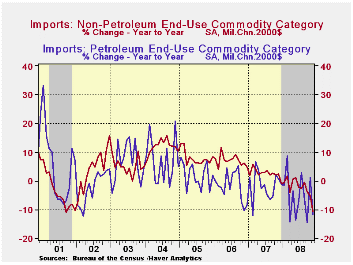
Recessions abroad lowered U.S. exports for the fourth consecutive month. Moreover, the 5.8% decline was near the largest since 2001. The decline reflected a sharp 7.2% drop in goods exports following a 2.8% shortfall during October. Adjusted for prices, chained-dollar goods exports fell 3.3% (-2.5% y/y). Real exports of capital goods declined 3.6% (-6.7% y/y) for the third consecutive monthly drop, a period during which these exports have fallen 13.5%. Exports of nonauto consumer goods slipped 0.6%, off 5.9% during the last three months and real exports of automobiles & parts fell 10.9% (-18.0% y/y).
Nominal exports of services fell 2.5% (+3.0% y/y). Travel exports fell hard for the third straight month. The 3.7% decline reflected lower passenger fares which fell 4.3%. They remained up 6.0% y/y after 16.1% growth last year. Exports of "other" private services fell 2.1% dropping the year-to-year growth to 2.4% after an 18.2% gain during all of last year.
The U.S. trade deficit in goods with China narrowed to $23.1B, the smallest since June. Exports to China reversed all of the October gain and fell 14.0% (-10.7% y/y). Imports fell a hard 16.9% (-5.0% y/y) due to the U.S. recession. The trade deficit with Japan narrowed m/m to $5.0B which was near the shallowest since 2003. So far this year the deficit has dropped to $6.1B from an average $6.9B during the first eleven months of last year.
The Crisis and the Policy Response is today's speech by Fed Chairman Ben S. Bernanke and it can be found here.
Beyond Shocks: What Causes Business Cycles? An Overview is a 1998 study from the Federal Reserve Bank of Boston and it is available here.
| Foreign Trade | November | October | Y/Y | 2007 | 2006 | 2005 |
|---|---|---|---|---|---|---|
| U.S. Trade Deficit | $40.4 | $56.7B | $60.0B (11/07) | $700.3 | $753.3 | $711.6B |
| Exports - Goods & Services | -5.8% | -2.3% | -1.7% | 13.0% | 13.5% | 10.6% |
| Imports - Goods & Services | -12.0% | -1.6% | -10.6% | 6.1% | 10.8% | 12.8% |
| Petroleum | -36.5% | 1.8% | -30.3% | 9.4% | 20.1% | 39.6% |
| Nonpetroleum Goods | -7.8% | -2.5% | -9.3% | 4.8% | 9.1% | 10.3% |

Tom Moeller
AuthorMore in Author Profile »Prior to joining Haver Analytics in 2000, Mr. Moeller worked as the Economist at Chancellor Capital Management from 1985 to 1999. There, he developed comprehensive economic forecasts and interpreted economic data for equity and fixed income portfolio managers. Also at Chancellor, Mr. Moeller worked as an equity analyst and was responsible for researching and rating companies in the economically sensitive automobile and housing industries for investment in Chancellor’s equity portfolio. Prior to joining Chancellor, Mr. Moeller was an Economist at Citibank from 1979 to 1984. He also analyzed pricing behavior in the metals industry for the Council on Wage and Price Stability in Washington, D.C. In 1999, Mr. Moeller received the award for most accurate forecast from the Forecasters' Club of New York. From 1990 to 1992 he was President of the New York Association for Business Economists. Mr. Moeller earned an M.B.A. in Finance from Fordham University, where he graduated in 1987. He holds a Bachelor of Arts in Economics from George Washington University.
More Economy in Brief


