 Global| Feb 10 2010
U.S. Trade Deficit Hits 12-MonthHigh
by:Tom Moeller
|in:Economy in Brief
Summary
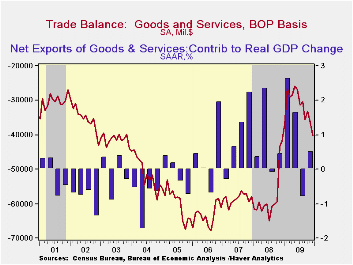
Higher oil prices and economic recovery were December's double-punch to the U.S. trade accounts. Together, they raised imports and increased the international trade deficit to $40.2B which was the highest level in twelve months. The [...]
 Higher
oil prices and economic recovery were December's double-punch to the
U.S. trade accounts. Together, they raised imports and increased the
international trade deficit to $40.2B which was the highest level in
twelve months. The rise was from November's unrevised deficit of
$36.4B. The latest figure was quite a bit higher than Consensus
expectations for a deficit of $35.5B.
Higher
oil prices and economic recovery were December's double-punch to the
U.S. trade accounts. Together, they raised imports and increased the
international trade deficit to $40.2B which was the highest level in
twelve months. The rise was from November's unrevised deficit of
$36.4B. The latest figure was quite a bit higher than Consensus
expectations for a deficit of $35.5B.
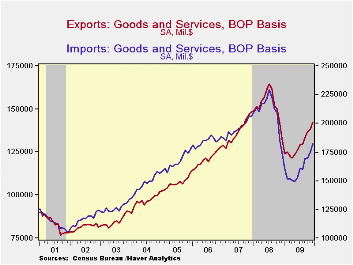
Imports rose 4.8% in part due to a rise in crude oil prices to $73.20 per barrel which was the highest price since October of 2008. In addition the quantity of crude oil imports jumped 14.3% (-17.5% y/y) to the highest level since March. U.S. economic recovery also was evident in a 3.3% increase (3.0% y/y) in real nonoil imports which was the fifth increase in six months. Real non-auto capital goods imports jumped 4.6% (2.5% y/y) after a 3.9% November increase. Real automotive vehicles & parts imports also were strong with a 9.6% increase (18.9% y/y) and have nearly doubled since May. Real nonauto consumer goods imports were unchanged (3.4% y/y) following earlier strength since June. Finally, services imports jumped 1.1% (-1.5% y/y) and have risen a firm 6.5% since March. U.S. travels abroad rose 1.8% (-5.4% y/y recouping the November decline while passenger fares jumped 2.9% (-20.5% y/y).
Again reflecting the competitive value of the dollar, nominal exports jumped 3.3% m/m and by 17.3% from the April low. More impressive was the 4.4% monthly increase in real merchandise exports which are up 18.7% from their low. Real capital goods exports jumped 5.2% in December (0.6% y/y) and have risen 14.9% from their low. Real exports of non-auto consumer goods also posted a firm 2.1% gain and have risen 16.2% from the January low. Real automotive exports surged 10.2% in December and by 17.4% during the last twelve months. Exports of services slipped 0.1% (-0.3% y/y).
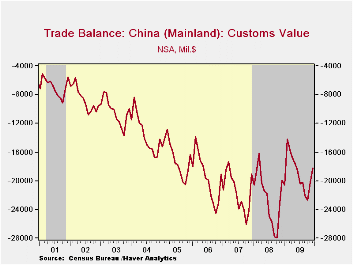
By country, the trade deficit with mainland China lessened to $18.1B, its least since April. The deficit has narrowed from its peak of $27.9B in October of 2008. Exports to China rose nearly two-thirds y/y while imports rose just 5.7%. With Japan, the trade deficit improved modestly to $4.6B from $5.3B one year earlier as exports rose 9.7% and imports fell 2.7%. With the European Union, the trade deficit was stable m/m at $6.4B as exports declined 3.7% y/y and imports fell 4.5%.
The
international trade data can be found in Haver's USECON database.
Detailed figures are available in the USINT
database.
Is the International Role of the Dollar Changing? from the Federal Reserve Bank of New York can be found here.
| Foreign Trade | December | November | October | Y/Y | 2009 | 2008 | 2007 |
|---|---|---|---|---|---|---|---|
| U.S. Trade Deficit | $40.2B | $36.4B | $33.2B | $41.9B (12/08) | $380.7B | $695.9B | $701.4B |
| Exports - Goods & Services | 3.3% | 0.9% | 2.7% | 7.4% | -15.0% | 11.2% | 13.2% |
| Imports - Goods & Services | 4.8 | 2.6 | 0.7 | 4.6 | -23.3 | 7.6 | 6.0 |
| Petroleum | 14.8 | 0.3 | -10.6 | 24.5 | -44.1 | 37.0 | 9.4 |
| Nonpetroleum Goods | 3.8 | 2.3 | 3.2 | 2.6 | -21.0 | 1.5 | 4.8 |
by Robert Brusca February 10, 2010
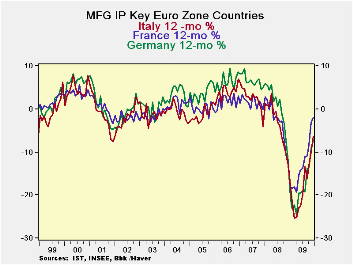
The drop –a sharp drop- in German IP has been echoed throughout the e-zone’s largest economies. In December IP has also fallen in France, in Italy and in Spain. The UK, an EU member country, reports that its IP rose by a strong 0.9% in December.
Over three-months all the large EMU members are showing moderating growth rates but only Germany and Spain have posted actual IP drops. Germany’s -14% rate of decline is huge. Spain’s three-month drop is just at a -4.7% annual rate- but is still substantial. Italy’s 5.9% gain over three months is the sharpest 3-mo gain among the lot of large e-Zone members. Outside the Zone, the UK’s 4.6% rise in output rivals Italy’s three-month gain. Better still, for the UK the acceleration in output is still in place.
For the fourth quarter, Germany continues to show that output expanded compared to Q3 even with the December weakness. France’s output also posted a rise in the quarter. Both Italy and Spain suffered setbacks in the quarter; Spain’s 6.2% annual rate of decline is especially deep. The UK’s IP registers a rise at a pace of 3.2% in the quarter.
The chart at the top of this report plots Yr/Yr rates of growth and on that basis the recovery in output still seems to be fully in train. But the widespread drop off in output in December must be taken as bad news. But how bad? The UK is not in EMU but it is still in the same region and trades with most of the same partners as Europe yet its IP managed a rather large boost in December. Perhaps the UK results give us some reassurance that output in the Zone is not on the brink of collapsing. It’s too soon to tell what December means for the trend but the drop off is not the sort of signal of weakness or even of slowing growth that we want to see at this time. The recovery’s fragility underlines Mervyn King’s statement that it is too soon to put a definitive end the BOE’s securities purchase program.
Meanwhile those looking for more guidance on policy will have to wait another day. US central bank head Ben Bernanke has his testimony put off for a day due to a Washington DC snow storm. We will not get the usual information from questioning of the Chairman until he testifies on Thursday. But the Fed Chairman’s speech is being released on time today so his general thoughts will available as previously scheduled.
| Main Euro-Area Countries and UK IP in MFG | |||||||
|---|---|---|---|---|---|---|---|
| Mo/Mo | 3-Mo | 6-mo | 12-mo | Dec-09 | |||
| MFG Only | Dec-09 | Nov-09 | Oct-09 | Dec-09 | Dec-09 | Dec-09 | Q:4-Date |
| Germany: | -2.8% | 0.9% | -1.8% | -14.0% | 1.9% | -7.2% | 3.6% |
| France:IPxConstruct'n | -0.1% | 0.6% | -0.1% | 1.4% | 4.6% | -2.3% | 0.3% |
| Italy | -0.1% | 0.4% | 1.2% | 5.9% | 6.7% | -6.3% | -1.4% |
| Spain | -0.6% | -0.1% | -0.5% | -4.7% | 1.2% | -2.4% | -6.2% |
| UK | 0.9% | 0.2% | 0.0% | 4.6% | 2.3% | -1.9% | 3.2% |
| Mo/Mo are simple percent changes others are at saars | |||||||
by Tom Moeller February 10, 2010
 The
Mortgage
Bankers Association reported that mortgage applications slipped 1.2%
last week after a 21.0% jump at the end of January. As a result,
applications began February up sharply from last month.
The
Mortgage
Bankers Association reported that mortgage applications slipped 1.2%
last week after a 21.0% jump at the end of January. As a result,
applications began February up sharply from last month.
Applications to refinance mortgages increased 1.4% last week and were double the June low due to rate declines. Applications to purchase a home have not shared that degree of strength. They fell 7.0% last week after declining in January from December. The volatility in the numbers likely reflects the expiration of an up-to $8,000 Federal tax credit for first-time homebuyers which was extended to April. During the last ten years there has been a 51% correlation between the y/y change in purchase applications and the change in new plus existing single family home sales. The correlation has lessened recently.
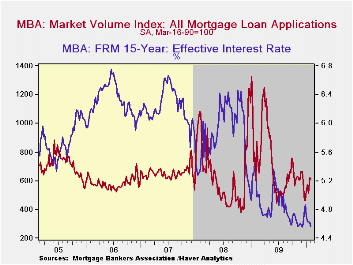
The effective fixed
interest rate on conventional 15-year mortgages slipped last week to
4.57%. That equaled the November low and was down from the June average
of 5.21%. 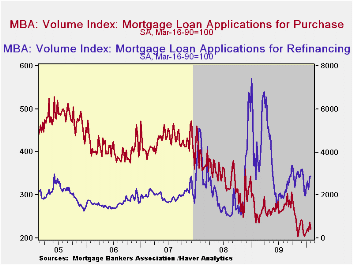 For 30-year mortgages the rate ticked up last week to 5.16%
from a November average of 5.06%. Rates reached a high of 5.79% in
early-June. Interest rates on fixed 15-year and 30-year mortgages are
closely correlated (near-90%) with the rate on 10-year Treasury
securities. Rates on adjustable one-year mortgages fell to 6.64% last
week from a November average of 6.81%.
For 30-year mortgages the rate ticked up last week to 5.16%
from a November average of 5.06%. Rates reached a high of 5.79% in
early-June. Interest rates on fixed 15-year and 30-year mortgages are
closely correlated (near-90%) with the rate on 10-year Treasury
securities. Rates on adjustable one-year mortgages fell to 6.64% last
week from a November average of 6.81%.
Since a December low, the number of fixed-rate mortgages has risen by one third and roughly equaled the rise in adjustable-rate mortgage applications.
The Mortgage Bankers Association surveys between 20 to 35 of the top lenders in the U.S. housing industry to derive its refinance, purchase and market indexes. The weekly survey covers roughly 50% of all U.S. residential mortgage applications processed each week by mortgage banks, commercial banks and thrifts. Visit the Mortgage Bankers Association site here. The figures for weekly mortgage applications are available in Haver's SURVEYW database.
Federal Reserve's exit strategy is this morning's House testimony by Fed Chairman Ben S. Bernanke and it can be found here.
| MBA Mortgage Applications (SA, 3/16/90=100) | 02/05/10 | 01/29/10 | Y/Y | 2009 | 2008 | 2007 |
|---|---|---|---|---|---|---|
| Total Market Index | 613.1 | 620.7 | 2.1% | 736.4 | 642.9 | 652.6 |
| Purchase | 221.2 | 237.8 | -6.2 | 263.5 | 345.4 | 424.9 |
| Refinancing | 2,893.9 | 2,854.8 | 6.3 | 3,509.2 | 2,394.1 | 1,997.9 |
| 15-Year Mortgage Effective Interest Rate (%) | 4.57 | 4.62 | 5.07 (02/09) | 4.85 | 5.9 | 6.2 |

Tom Moeller
AuthorMore in Author Profile »Prior to joining Haver Analytics in 2000, Mr. Moeller worked as the Economist at Chancellor Capital Management from 1985 to 1999. There, he developed comprehensive economic forecasts and interpreted economic data for equity and fixed income portfolio managers. Also at Chancellor, Mr. Moeller worked as an equity analyst and was responsible for researching and rating companies in the economically sensitive automobile and housing industries for investment in Chancellor’s equity portfolio. Prior to joining Chancellor, Mr. Moeller was an Economist at Citibank from 1979 to 1984. He also analyzed pricing behavior in the metals industry for the Council on Wage and Price Stability in Washington, D.C. In 1999, Mr. Moeller received the award for most accurate forecast from the Forecasters' Club of New York. From 1990 to 1992 he was President of the New York Association for Business Economists. Mr. Moeller earned an M.B.A. in Finance from Fordham University, where he graduated in 1987. He holds a Bachelor of Arts in Economics from George Washington University.
More Economy in Brief


