 Global| Apr 09 2009
U.S. Trade Deficit Falls FurtherTo Lowest Since 1999
by:Tom Moeller
|in:Economy in Brief
Summary
Amidst the worldwide economic recession, the U.S. foreign trade deficit fell further during February to the lowest level since November of 1999. The deficit of $26.0B narrowed from the little revised January level of $36.2B. Imports [...]
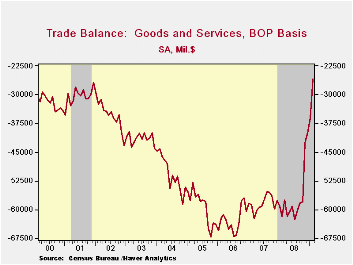 Amidst
the worldwide economic recession, the U.S. foreign trade deficit fell
further during February to the lowest level since November of 1999. The
deficit of $26.0B narrowed from the little revised January level of
$36.2B. Imports continued to show the effects of the recession and
lower oil prices by posting a 5.1% decline which pulled them down by
28.8% year-to-year. Exports went the other way in February as they rose
for the first time since July. Consensus expectations had been for a
January deficit of $36.6B.
Amidst
the worldwide economic recession, the U.S. foreign trade deficit fell
further during February to the lowest level since November of 1999. The
deficit of $26.0B narrowed from the little revised January level of
$36.2B. Imports continued to show the effects of the recession and
lower oil prices by posting a 5.1% decline which pulled them down by
28.8% year-to-year. Exports went the other way in February as they rose
for the first time since July. Consensus expectations had been for a
January deficit of $36.6B.
Adjusted for price inflation, the trade deficit in goods narrowed as well. The real trade deficit of $35.6B was its lowest since the 2001 recession and down from $51.3B last February.
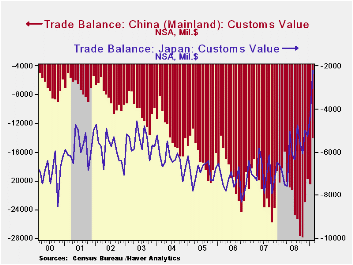
The U.S. trade deficit in goods with China narrowed to its lowest level ($14.2B) since early 2006 as imports fell 21.8% y/y while U.S. exports fell 19.0%. The trade deficit with Japan also narrowed sharply to $2.2B, its shallowest since 1984. The U.S. recession dropped imports by roughly one-half from one year ago while exports fell 25.7%.
Measured in chained-2000 dollars nonoil imports fell another 5.3% with the recession (-22.2% y/y). Overall real non-auto consumer goods imports fell 16.8% y/y to their lowest level since early 2005. Imports of automotive vehicles & parts were down 54.1% y/y while non-auto capital goods imports fell 22.7% y/y, also to their lowest since 2005.· Services imports fell another 1.9%, about as they did in January (-6.6% y/y), and they were down for the sixth consecutive month. The decline reflected yet another decline in travel imports (-8.2% y/y) while passenger fares were off by 10.4% versus February of 2008.
Despite the recessions abroad, real exports
of goods posted a 3.1% increase during February. However, that
nevertheless left them down 17.4% y/y at near the lowest level since
early-2006. 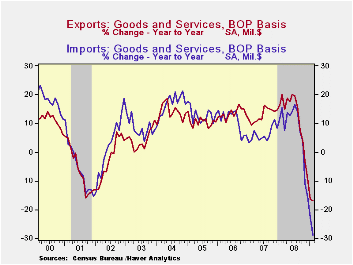 The chained dollar value of non-auto consumer goods exports
led the overall gain with an 11.2% increase (-6.8% y/y) while capital
goods exports ticked up 0.4% (-16.6% y/y). Real exports of automobiles
& parts increased 8.8% but they remained off by nearly one-half
during the last year.
The chained dollar value of non-auto consumer goods exports
led the overall gain with an 11.2% increase (-6.8% y/y) while capital
goods exports ticked up 0.4% (-16.6% y/y). Real exports of automobiles
& parts increased 8.8% but they remained off by nearly one-half
during the last year.
Nominal exports of services fell 1.0% (-5.5% y/y), their fifth decline in the last six months. Travel exports were down 13.5% y/y as fewer foreign citizens came to the U.S. while passenger fares fell 11.5%.
The international trade data can be found in Haver's USECON database. Detailed figures are available in the USINT database.
The Minutes of the latest Federal Open Market Committee can be found here.
| Foreign Trade | February | January | Y/Y | 2008 | 2007 | 2006 |
|---|---|---|---|---|---|---|
| U.S. Trade Deficit | $26.0B | $36.2B | $61.9B (02/08) | $681.1 | $700.3 | $753.3 |
| Exports - Goods & Services | 1.6% | -5.9% | -16.9% | 11.5% | 13.0% | 13.5% |
| Imports - Goods & Services | -5.1% | -6.7% | -28.8% | 7.3 | 6.1% | 10.8% |
| Petroleum | -8.2% | -18.1% | -56.0% | 37.0 | 9.4% | 20.1% |
| Nonpetroleum Goods | -5.5% | -5.8% | -26.0% | 1.3% | 4.8% | 9.1% |
by Robert Brusca April 9, 2009
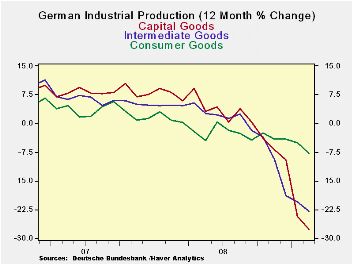
We saw the weakness in German orders so it is not surprising
that output is having the same experience in Germany . Industrial
output fell by a large 2.9% in January on the heels of a dizzying 6.1%
drop in January. Output is declining at an even faster rate over
three-months than over six months and over six months the annual rate
pace of decline is -35%, over three months it is -40.8%. The
deceleration in output is being led by the important capital goods
sector. The rate of decline in consumer goods output and in
intermediate goods is still large but those two sectors have held the
line in February with the same 3-month growth rate as for six months.
Capital goods are plunging at a 60% rate up sharply from a -40% pace
over six months. This is a sector that is important to German exporters
and German foreign-sourced orders have been falling sharply. Output in
the construction sector managed a rise in Feb after a super-plunge in
January; it has been volatile. Its 3-monht growth rate is nearly
neutral (-0.8% saar). Manufacturing
IP is down even more sharply over three months at -47% compared to -39%
over six months. Orders weakness suggests there is more of this to come.
| Total German IP | |||||||
|---|---|---|---|---|---|---|---|
| Saar exept m/m | Feb-09 | Jan-09 | Dec-08 | 3-mo | 6-mo | 12-mo | Quarter- to-Date |
| IP total | -2.9% | -6.1% | -3.9% | -40.8% | -35.0% | -20.3% | -43.1% |
| Consumer | -3.6% | -0.6% | 1.4% | -11.0% | -12.9% | -7.7% | -10.8% |
| Capital | -4.5% | -14.1% | -3.2% | -60.1% | -46.4% | -27.6% | -62.8% |
| Intermed | -1.9% | -2.1% | -9.1% | -41.9% | -40.6% | -22.8% | -43.2% |
| Memo | |||||||
| Construction | 1.9% | -7.5% | 5.9% | -0.8% | -6.0% | -14.6% | -13.3% |
| MFG IP | -3.4% | -7.3% | -4.8% | -47.3% | -39.3% | -22.5% | -49.1% |
| MFG Orders | -3.5% | -6.7% | -7.3% | -51.5% | -55.6% | -36.3% | -54.5% |
by Tom Moeller April 9, 2009
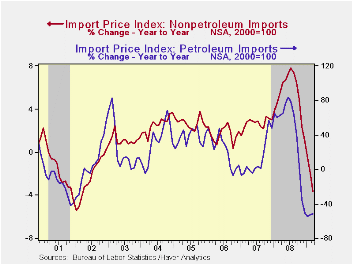
U.S. import prices rose for the first month since last July due to a rise in oil prices. Overall, the 0.5% rise in import prices was the first though pricing power continued weak due to the worldwide recession. During the last twelve months, the 14.9% decline in import prices was a record for the series which dates back to 1983. The March figure compares to Consensus expectations for a 0.9% increase.
Last month, petroleum prices firmed another 10.5% following the 4.4% February gain. This month, the average cost of $51.33 per barrel of Brent crude is even higher than the March level.
That strength was offset, however, by the worldwide recession.
Nonoil import prices fell during March by 0.7% and that was the eighth
consecutive monthly decline. During that period prices have fallen 7.0%.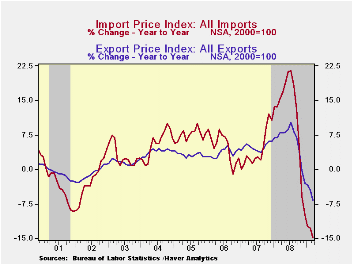
Through early April, the foreign exchange value of the dollar rose 17.0% versus its year-ago level and further reduced the pressure on U.S. import prices. During the last ten years, there has been a negative 81% correlation between the nominal trade-weighted exchange value of the US dollar vs. major currencies and the y/y change in non-oil import prices.
Capital goods import prices during March fell by another 0.3% and on a three-month basis prices fell at a 3.0% annual rate after 5%-to-6% rates of increase early in 2008. Excluding the lower prices of computers, March prices of capital goods fell 0.4% for the second month. Three-month growth was -1.1% which was a reversal of the 4.3% increase during all of last year. Prices of computers, peripherals & accessories were unchanged month-to-month and down at an 8.2% rate during the last three months.
The recession's toll on prices was notably evident in the 0.5% decline in March prices for nonauto consumer goods. Their three-month rate of change was a negative 1.5% versus the 5.9% peak rate of growth in early-2008. Durable nonauto consumer goods prices fell at a 3.9% annual rate during the last three months, a reversal from the 6.2% peak rate of increase in early 2008. Still moving higher, apparel prices rose at a reduced 0.8% rate during that period but the gain was offset by a 14.4% rate of decline in home entertainment product prices.
Total export prices fell another 0.6% last month and at a 1.0% rate during the last three. Nonagricultural export prices fell 0.3% (5.0% y/y) and agricultural prices fell 3.5% (-21.8% y/y).
The import and export price series can be found in Haver's USECON database. Detailed figures are available in the USINT database.
The Success of the CPFF? from the Federal Reserve Bank of St. Louis is available here.
| Import/Export Prices (NSA, %) | March | February | Y/Y | 2008 | 2007 | 2006 |
|---|---|---|---|---|---|---|
| Import - All Commodities | 0.5 | -0.1 | -14.9 | 11.5 | 4.2 | 4.9 |
| Petroleum | 10.5 | 4.4 | -52.0 | 37.7 | 11.6 | 20.6 |
| Nonpetroleum | -0.7 | -0.6 | -3.7 | 5.3 | 2.7 | 1.7 |
| Export- All Commodities | -0.6 | -0.2 | -6.7 | 6.0 | 4.9 | 3.6 |

Tom Moeller
AuthorMore in Author Profile »Prior to joining Haver Analytics in 2000, Mr. Moeller worked as the Economist at Chancellor Capital Management from 1985 to 1999. There, he developed comprehensive economic forecasts and interpreted economic data for equity and fixed income portfolio managers. Also at Chancellor, Mr. Moeller worked as an equity analyst and was responsible for researching and rating companies in the economically sensitive automobile and housing industries for investment in Chancellor’s equity portfolio. Prior to joining Chancellor, Mr. Moeller was an Economist at Citibank from 1979 to 1984. He also analyzed pricing behavior in the metals industry for the Council on Wage and Price Stability in Washington, D.C. In 1999, Mr. Moeller received the award for most accurate forecast from the Forecasters' Club of New York. From 1990 to 1992 he was President of the New York Association for Business Economists. Mr. Moeller earned an M.B.A. in Finance from Fordham University, where he graduated in 1987. He holds a Bachelor of Arts in Economics from George Washington University.
More Economy in Brief


