 Global| Oct 13 2005
U.S. Trade Deficit Deeper Due to Oil
by:Tom Moeller
|in:Economy in Brief
Summary
Higher oil prices caused the U.S. foreign trade deficit to deepen in August to $59.0B from a July deficit of $58.0B which was little revised. Consensus expectations had been for a slightly deeper August deficit of $59.5B. Imports of [...]
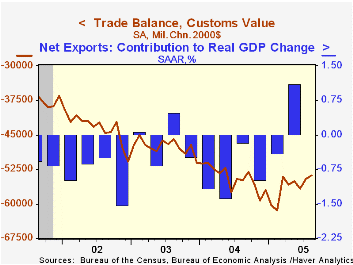
Higher oil prices caused the U.S. foreign trade deficit to deepen in August to $59.0B from a July deficit of $58.0B which was little revised. Consensus expectations had been for a slightly deeper August deficit of $59.5B.
Imports of goods & services jumped 1.8%. Petroleum imports surged 8.7% (41.4% y/y) driven by a 7.4% (44.1% y/y) rise in the per barrel price of crude petroleum though in both September and in early October the price of Brent crude has fallen to $59.53/bbl. from the weekly August peak over $ 66.00/bbl.
Nonpetroleum goods imports rose 0.9% (8.0% y/y) in August against a 2.9% (12.7% y/y) rise in exports. Recent strength in exports shrank the nonpetroleum deficit to its narrowest since March.
Capital goods imports recovered 0.5% (10.2% y/y) following a 2.4% decline in July while a 0.3% (+8.8% y/y) decline in nonauto consumer goods followed a 1.9% July drop. Imports of advanced technology products jumped 1.6% (NSA, 8.4% y/y).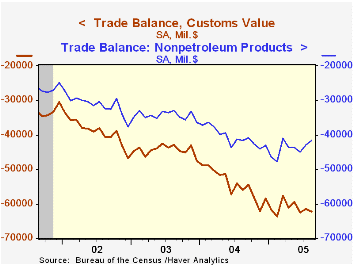
Total exports surged 1.7% after the modest 0.5% July up tick. Capital goods exports gained 3.8% (11.8% y/y) while exports of advanced technology products recovered some momentum after a July decline and rose 7.2% (NSA, 15.9% y/y). Nonauto consumer goods exports fell 0.2% (+9.4% y/y).
Services exports rose 0.7% (10.7% y/y). Private travel services fell 0.4% (+14.2% y/y) following a 2.0% July drop but "other" private services jumped 1.6% (5.3% y/y).
The US trade deficit with China deepened to a record $18.5B ($161.9B in 2004) as imports surged 5.1% (NSA, 23.8% y/y). The US trade deficit with Japan improved slightly to $6.6B ($75.6B in 2004) due to a 4.9% (NSA, 15.7% y/y) jump in exports. The monthly trade deficit with the Asian NICs was about unchanged at $1.2B ($21.9B in 2004) for the fourth consecutive month and the deficit with the European Union also was about unchanged at $11.3B ($109.3B in 2004).
U.S. Jobs Gained and Lost through Trade: A Net Measure from the Federal Reserve Bank of New York is available here.
| Foreign Trade | Aug | July | Y/Y | 2004 | 2003 | 2002 |
|---|---|---|---|---|---|---|
| Trade Deficit | $59.0B | $58.0B | $54.2B (8/04) | $617.6B | $494.8B | $421.2B |
| Exports - Goods & Services | 1.7% | 0.5% | 12.1% | 12.6% | 4.6% | -3.0% |
| Imports - Goods & Services | 1.8% | -0.6% | 10.9% | 16.6% | 8.5% | 2.1% |

Tom Moeller
AuthorMore in Author Profile »Prior to joining Haver Analytics in 2000, Mr. Moeller worked as the Economist at Chancellor Capital Management from 1985 to 1999. There, he developed comprehensive economic forecasts and interpreted economic data for equity and fixed income portfolio managers. Also at Chancellor, Mr. Moeller worked as an equity analyst and was responsible for researching and rating companies in the economically sensitive automobile and housing industries for investment in Chancellor’s equity portfolio. Prior to joining Chancellor, Mr. Moeller was an Economist at Citibank from 1979 to 1984. He also analyzed pricing behavior in the metals industry for the Council on Wage and Price Stability in Washington, D.C. In 1999, Mr. Moeller received the award for most accurate forecast from the Forecasters' Club of New York. From 1990 to 1992 he was President of the New York Association for Business Economists. Mr. Moeller earned an M.B.A. in Finance from Fordham University, where he graduated in 1987. He holds a Bachelor of Arts in Economics from George Washington University.
More Economy in Brief


