 Global| Dec 05 2017
U.S. Trade Deficit Deepens as Petroleum Imports Surge
by:Tom Moeller
|in:Economy in Brief
Summary
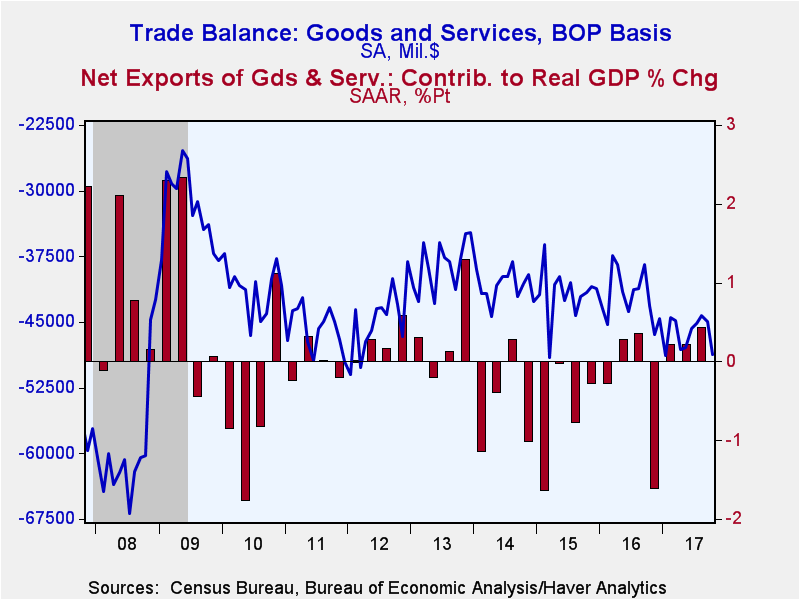
The U.S. trade deficit in goods and services increased to $48.7 billion in October from $44.9 billion in September, revised from $43.5 billion. A $46.6 billion deficit had been expected in the Action Economics Forecast Survey. Total [...]
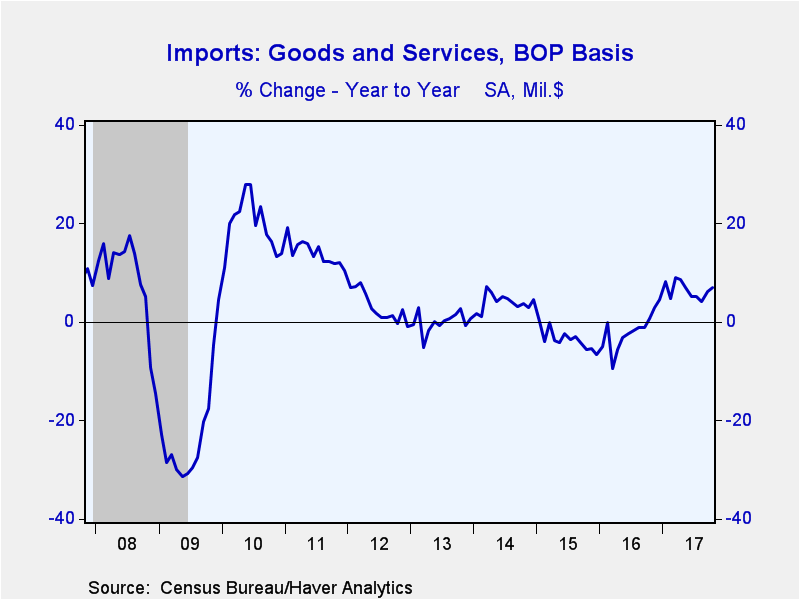
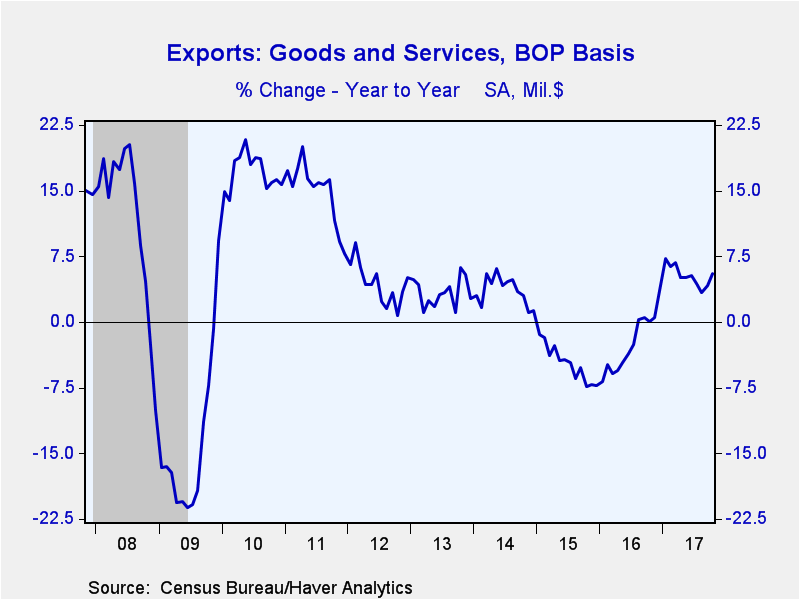
The U.S. trade deficit in goods and services increased to $48.7 billion in October from $44.9 billion in September, revised from $43.5 billion. A $46.6 billion deficit had been expected in the Action Economics Forecast Survey. Total exports were little changed (5.6% y/y) after a 1.1% increase in September. Imports strengthened 1.6% (7.0% y/y) after a 1.2% rise.
Deterioration in the goods deficit to $68.1 billion from $64.0 billion led the increase in the total deficit. Merchandise imports gained 1.8% (7.4% y/y), the largest monthly rise since January. Industrial supplies & materials imports rose 4.3% (13.8% y/y), reflecting a gain in petroleum imports. Nonauto consumer goods imports increased 1.6% (1.5% y/y) after a 0.7% rise, while auto imports gained 0.2% (1.5% y/y) following a 1.8% decline. Foods, feeds & beverage imports gained 0.1% (8.1% y/y) following a 1.8% surge. Nonauto capital goods imports eased 0.4% (+10.7% y/y) after a 2.8% surge.
The value of petroleum imports strengthened 8.4% (17.0%) after a 2.2% increase. The real value increased 4.6% (-0.4% y/y) after a 3.3% decline. The per barrel cost of crude petroleum increased to $47.26 (18.1% y/y). That was the highest level since August 2015 and up from a February 2016 low of $27.49. The value of nonpetroleum imports increased 1.3% (6.7% y/y), about the same as in September.
Merchandise exports eased 0.4% (+6.1% y/y) following 1.7% jump. Foods, feeds & beverage exports declined 11.2% (-2.8% y/y), the second sharp decline in three months. Capital goods exports fell 2.7% (+0.2% y/y) after a 0.5% slip. Nonauto consumer goods exports eased 2.1% (+0.8% y/y), the third sharp decline in four months. Nonauto consumer goods were off 1.2% (+2.2% y/y), down 4.2% since February. Reflecting the rise in prices, petroleum product exports jumped 6.8% (22.1% y/y) after a 5.2% surge.
The trade surplus in services held fairly steady at $20.3 billion. Services imports increased 0.7% (5.8% y/y) after strengthening 1.1% during September. Transport imports surged 3.3% (5.1% y/y), about the same as in the prior month. Charges for intellectual property rights strengthened 1.3% (13.4% y/y), roughly the same as during each of the prior six months. Travel imports eased 0.4% (+6.5% y/y) following a 0.1% uptick.
Services exports gained 0.5% (4.0% y/y) following a 0.6% rise. Charges for intellectual rights rose 0.3% (1.9% y/y) and reversed a 0.2% decline. Travel exports rose 0.2% (-1.6% y/y) following no change and transport exports increased 0.8% (6.1% y/y) after a 4.4% jump.
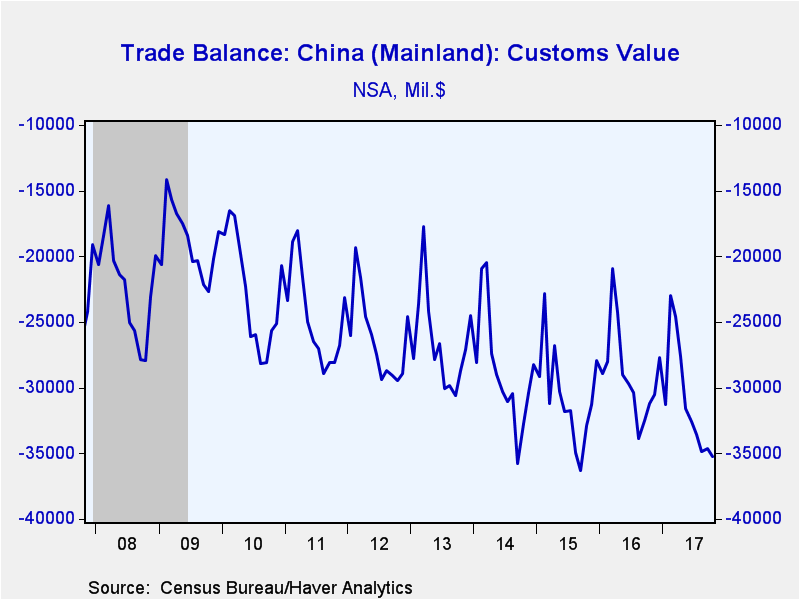
By country, the goods trade deficit with China deepened to $35.2 billion (NSA) in October from $34.6 billion in September and was wider than the $31.2 billion deficit reported one year earlier. Export growth weakened drastically to 2.8% y/y while import growth picked up to 10.1% y/y. The trade deficit with Japan eased to $6.4 billion. Exports declined 2.9% y/y and imports rose 3.0% y/y. The trade deficit with the European Union widened m/m to $13.7 billion, but was little changed y/y. Export growth to the EU rose to 11.8% y/y while import growth also accelerated to 9.3% y/y.
The international trade data can be found in Haver's USECON database. Detailed figures are available in the USINT database. The expectations figures are from the Action Economics Forecast Survey, which is carried in AS1REPNA.
| Foreign Trade in Goods & Services (Current Dollars) | Oct | Sep | Aug | Y/Y | 2016 | 2015 | 2014 |
|---|---|---|---|---|---|---|---|
| U.S. Trade Deficit | $48.7 bil. | $44.9 bil. | $44.3 bil. | $43.1 bil. (10/16) |
$504.8 bil. | $500.4 bil. | $490.3 bil. |
| Exports of Goods & Services (% Chg) | -0.0 | 1.1 | 0.2 | 5.6 | -2.5 | -4.7 | 3.6 |
| Imports of Goods & Services (% Chg) | 1.6 | 1.2 | -0.2 | 7.0 | -1.9 | -3.6 | 4.0 |
| Petroleum (% Chg) | 8.4 | 2.2 | 5.1 | 17.0 | -19.4 | -45.5 | -9.7 |
| Nonpetroleum Goods (% Chg) | 1.3 | 1.2 | -0.6 | 6.7 | -1.2 | 2.2 | 6.5 |
Tom Moeller
AuthorMore in Author Profile »Prior to joining Haver Analytics in 2000, Mr. Moeller worked as the Economist at Chancellor Capital Management from 1985 to 1999. There, he developed comprehensive economic forecasts and interpreted economic data for equity and fixed income portfolio managers. Also at Chancellor, Mr. Moeller worked as an equity analyst and was responsible for researching and rating companies in the economically sensitive automobile and housing industries for investment in Chancellor’s equity portfolio. Prior to joining Chancellor, Mr. Moeller was an Economist at Citibank from 1979 to 1984. He also analyzed pricing behavior in the metals industry for the Council on Wage and Price Stability in Washington, D.C. In 1999, Mr. Moeller received the award for most accurate forecast from the Forecasters' Club of New York. From 1990 to 1992 he was President of the New York Association for Business Economists. Mr. Moeller earned an M.B.A. in Finance from Fordham University, where he graduated in 1987. He holds a Bachelor of Arts in Economics from George Washington University.


