 Global| Feb 13 2007
U.S. Trade Deficit Deepened Unexpectedly
by:Tom Moeller
|in:Economy in Brief
Summary
The U.S. foreign trade deficit deepened unexpectedly in December to $61.2B from a little revised $58.1B during November. The figure compared to Consensus expectations for a deficit of $59.6B. For the year, the trade deficit deepened [...]
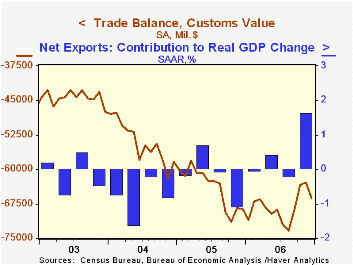
The U.S. foreign trade deficit deepened unexpectedly in December to $61.2B from a little revised $58.1B during November. The figure compared to Consensus expectations for a deficit of $59.6B. For the year, the trade deficit deepened to a record $763.5B.
Total exports rose 0.6% after an upwardly revised 1.1% gain in November. Export of non-auto consumer goods rose 1.2% for the third straight strong increase, and for the year rose 11.7%. Capital goods, however, slipped 0.2% in December though the firm 14.2% for the year benefited from a 16.9% rise in advanced technology goods and a 40.0% surge in complete civilian aircraft exports.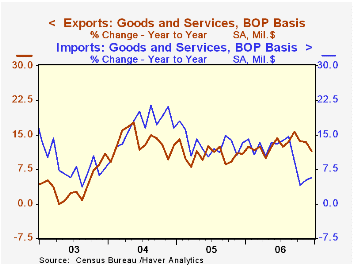
Imports of nonpetroleum products rose 1.6% (6.8% y/y) and for the year rose 9.2%. Capital goods imports slipped 0.7% (+7.6% y/y) and for the year rose 10.4% while imports of nonauto consumer goods jumped 2.0% (13.4% y/y) while posting an 8.8% gain for the year. Imports of advanced technology products fell 7.2% (+7.6% y/y) and for the year gained 12.0%.
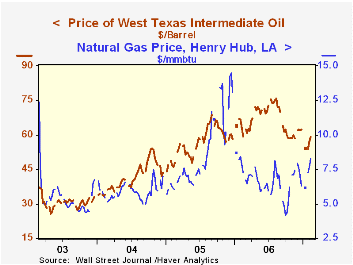
The value of petroleum product imports rose 7.6% (-2.3% y/y) as the price of Brent crude oil rose to $62.98 but the quantity of crude oil imports fell 5.1% (-6.6% y/y).
The U.S. trade deficit in goods with China improved m/m to $19.0B but for the year deepened to $232.5B from $201.5B in 2005. The balance of goods trade with the newly industrialized Asian improved to a $1.0 surplus, the first surplus in ten year and for the year the deficit narrowed to $11.8B from $15.8B in 2005).
Disentangling the Wealth Effect: Some International Evidence from the Federal Reserve Bank of San Francisco can be found here.
How Wages Change: Micro Evidence from the International Wage Flexibility Project from the Federal Reserve Bank of New York is available here.
| Foreign Trade | December | November | Y/Y | 2006 | 2005 | 2004 |
|---|---|---|---|---|---|---|
| U.S. Trade Deficit | $61.2B | $58.1B | $64.2B (12/05) |
$763.5 | $716.7B | $611.3B |
| Exports - Goods & Services | 0.6% | 1.1% | 11.5% | 12.8% | 10.7% | 13.4% |
| Imports - Goods & Services | 2.1% | 0.3% | 5.6% | 10.5% | 13.0% | 16.7% |
by Tom Moeller February 13, 2007
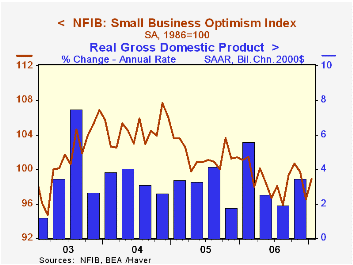
Small business optimism in January rose for the first month in three. The 2.5% increase recouped only a piece of the 3.2% December decline, according to the National Federation of Independent Business (NFIB).
During the last ten years there has been a 70% correlation between the level of the NFIB index and the two quarter change in real GDP.
Respondents expecting the economy to improve improved after December's sharp deterioration. The percentage of firms with job openings also improved to the highest level since last April.
During the last ten years there has been a 72% correlation between the NFIB percentage and the y/y change in nonfarm payrolls.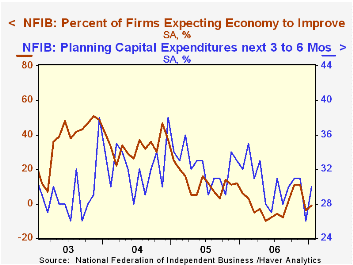
The percent planning to raise capital expenditures also improved and more than made up the sharp deterioration during December.
The percentage of firms actually raising prices recovered about half of the December decline. During the last ten years there has been a 60% correlation between the change in the producer price index and the level of the NFIB price index.
About 24 million businesses exist in the United States. Small business creates 80% of all new jobs in America.
Globalization and the Benefits of Trade from the Federal Reserve Bank of Chicago is available here.
| Nat'l Federation of Independent Business | January | December | Y/Y | 2006 | 2005 | 2004 |
|---|---|---|---|---|---|---|
| Small Business Optimism Index (1986=100) | 98.9 | 96.5 | -2.2% | 98.9 | 101.6 | 104.6 |
| · The International Council of Shopping Centers (ICSC)-UBS survey indicated that chain store sales slipped 0.8% last week after the sharp 1.3% increase to open February. · So far this month chain store sales are 0.3% ahead of January after a 2.8% average gain that month.· During the last ten years there has been a 45% correlation between the y/y change in chain store sales and the change in nonauto retail sales less gasoline.· The ICSC-UBS retail chain-store sales index is constructed using the same-store sales (stores open for one year) reported by 78 stores of seven retailers: Dayton Hudson, Federated, Kmart, May, J.C. Penney, Sears and Wal-Mart.· The leading indicator of chain store sales from ICSC-UBS fell 0.1% ((+0.4% y/y). |
|---|
| ICSC-UBS (SA, 1977=100) | 2/10/07 | 2/03/06 | Y/Y | 2006 | 2005 | 2004 |
|---|---|---|---|---|---|---|
| Total Weekly Chain Store Sales | 478.7 | 482.8 | 3.9% | 3.3% | 3.6% | 4.7% |
by Tom Moeller February 13, 2007
The Daily and Policy-relevant Liquidity Effects from the Federal Reserve Bank of St. Louis can be found here.
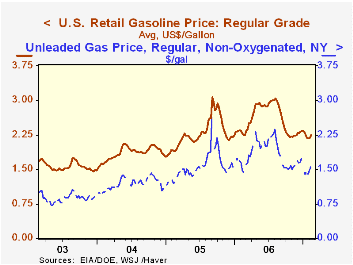
| Weekly Energy Prices | 02/12/07 | 02/05/07 | Y/Y | 2006 | 2005 | 2004 |
|---|---|---|---|---|---|---|
| US Retail Gasoline Price, Regular | $2.24 | $2.19 | -1.9% | $2.57 | $2.27 | $1.85 |
by Tom Moeller February 13, 2007
2006 was a good year for the euro area. Eurostat estimates that the Euro Area's Gross Domestic Product in real terms grew 0.9% in the fourth quarter of the year over the third quarter and was 3.3 above the fourth quarter of 2005. These figures suggest that growth in 2006 was 2.8%, the highest rate for the area since 2000.
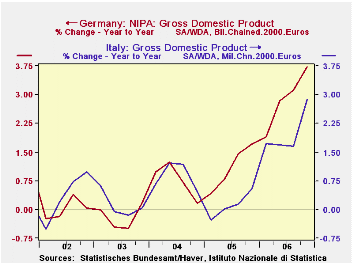
The four largest members of the euro area--Germany, France, Italy and Spain--as well as the Netherlands released fourth quarter data on GDP growth today. Among these countries, Germany was the big standout. Its GDP grew 0.87% in the fourth quarter and was 3.72% over the fourth quarter of 2005. Growth for all of 2006 was 2.79%. GDP growth in Italy in the fourth quarter increased sharply to 1.13% from 0.33% in the third quarter and was 2.87% over the fourth quarter of 2005. However, because of slow growth earlier in the year, the annual rate of growth was barely 2.0%. The year over year increases in GDP in Italy are compared to those in Germany in the first chart.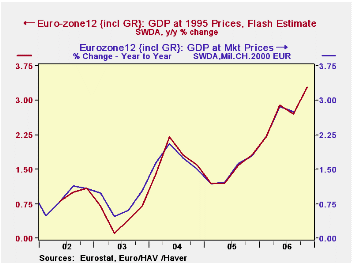
France also increased its GDP growth rate sharply in the fourth quarter of 2006 to 0.65% from 0.01%in the third quarter and was 2.27% above the fourth quarter of 2005. But GDP growth in France, like that in Italy was slow earlier in the year, as a result, growth for the year was just over 2.0%. Spain continued to be one of the high growers in the area. GDP in Spain was up 1.1% in the fourth quarter from the third and was 4% over the fourth quarter of 2005. For the year, Spain's GDP grew 3.79%. GDP growth in the Netherlands fell slightly in the fourth quarter to 0.64% from 0.72% in the third quarter and the year over year growth rate fell from 2.96 to 2.91%. For the year as a whole, GDP growth was 2.85%. The quarter to quarter and year to year growth rates of GDP are shown in the table below together with the annual growth rates of the past three years.Note: Eurostat and several euro area countries release flash estimates of Gross Domestic Product growth about a month and a half after the close of the quarter. Other countries within the euro area release preliminary estimates of GDP and its composition. Today France, Spain and Eurostat for the whole Euro Area released flash estimates of growth in the fourth quarter of 2006. France provides estimates of quarter to quarter growth only while Spain and Eurostat provide both quarter to quarter and year to year growth rates. The flash estimates have been good indicators of the actual growth rates as can be seen in the second chart that compares the flash estimates of the year over year changes in Euro Area growth and the actual changes.
Germany, Italy and the Netherlands released preliminary estimates of GDP and its composition..
| GROWTH RATES OF REAL GDP | Q4 06 (%) | 3Q 06 (%) | 2Q 06 (%) | 1Q 06 (%) | 2006 (%) | 2005 (%) | 2004 (%) |
|---|---|---|---|---|---|---|---|
| Y/Y Change | |||||||
| Euro Zone) | 3.3 | 2.7 | 2.9 | 2.2 | 2.79* | 1.46 | 1.74 |
| Germany | 3.72 | 3.11 | 2.82 | 1.90 | 2.89 | 1.10 | 0.77 |
| France | 2.27# | 1.85 | 2.58 | 1.33 | 2.01* | 1.21 | 2.03 |
| Italy | 2.87 | 1.66 | 1.70 | 1.73 | 1.99 | 0.11 | 0.88 |
| Spain | 4.0 | 3.82 | 3.72 | 3.61 | 3.79* | 3.53 | 3.26 |
| Netherlands | 2.91 | 2.96 | 2.96 | 2.59 | 2.85 | 1.53 | 1.95 |
| Q/Q Change | |||||||
| Euro Zone | 0.90 | 0.53 | 0.99 | 0.82 | -- | -- | -- |
| Germany | 0.87 | 0.79 | 1.18 | 0.84 | -- | -- | -- |
| France | 1.65 | 0.01 | 1.13 | 0.46 | -- | -- | -- |
| Italy | 1.13 | 0.33 | 0.61 | 0.78 | -- | -- | -- |
| Spain | 1.1 | 0.93 | 0.93 | 0.95 | -- | -- | -- |
| Netherlands | 0.69 | 0.72 | 1.21 | 0.30 | -- | -- | -- |

Tom Moeller
AuthorMore in Author Profile »Prior to joining Haver Analytics in 2000, Mr. Moeller worked as the Economist at Chancellor Capital Management from 1985 to 1999. There, he developed comprehensive economic forecasts and interpreted economic data for equity and fixed income portfolio managers. Also at Chancellor, Mr. Moeller worked as an equity analyst and was responsible for researching and rating companies in the economically sensitive automobile and housing industries for investment in Chancellor’s equity portfolio. Prior to joining Chancellor, Mr. Moeller was an Economist at Citibank from 1979 to 1984. He also analyzed pricing behavior in the metals industry for the Council on Wage and Price Stability in Washington, D.C. In 1999, Mr. Moeller received the award for most accurate forecast from the Forecasters' Club of New York. From 1990 to 1992 he was President of the New York Association for Business Economists. Mr. Moeller earned an M.B.A. in Finance from Fordham University, where he graduated in 1987. He holds a Bachelor of Arts in Economics from George Washington University.


