 Global| Dec 12 2007
U.S. Trade Deficit Deepened Slightly in October
by:Tom Moeller
|in:Economy in Brief
Summary
The U.S. foreign trade deficit deepened slightly to $57.8B from $57.1B in September which was slightly deeper than the deficit initially reported. Consensus expectations had been for a deficit of 57.3B. The deficit averaged $58.7B [...]
The U.S. foreign trade deficit deepened slightly to $57.8B from $57.1B in September which was slightly deeper than the deficit initially reported. Consensus expectations had been for a deficit of 57.3B.
The deficit averaged $58.7B during the first ten months of this year compared to an average of $64.0B during the first ten months of 2006.
U.S. exports rose 0.9% after a downwardly revised 0.8% during September. he revision was due a slightly lower gain in services exports
Exports of goods rose 0.7% (14.6% y/y) after a 1.4% jump
during September. Exports of capital goods surged 3.4% (10.4% y/y) led
by a 21.9% pop in exports of civilian aircraft (37.9% y/y. That rise
was offset by a 10.4% decline (+5.1% y/y) in exports of computers while
exports of electric apparatus rose 2.2% (4.6% y/y) after two months of
sharp decline. Exports of nonauto consumer goods also fell by 3.2%
+11.1% y/y).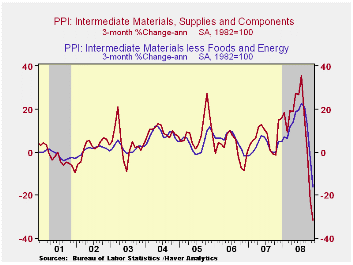
U.S. exports of services rose 1.4% after a decline of 0.5% during September, initially reported as an increase. Travel exports recovered 1.4% (19.4% y/y) and passenger fares surged 2.2% 16.8% y/y).
Overall imports rose 1.0% as higher oil prices pushed up imports of industrial supplies by 3.6% (16.3% y/y). Imports of nonauto consumer goods also rose a firm 1.1% (4.6% y/y) but capital goods imports fell 1.2% (+6.6% y/y) after a 2.1% September jump.
The U.S. trade deficit in goods with China again deteriorated m/m to $25.9B versus a deficit of $24.4B during October of '06. During the first ten months of this year the deficit with China averaged $21.4B versus $19.1B in 2006. Exports to China rose 13.9% y/y and imports rose 7.6%.
Today's announcement by the Federal Reserve of actions by it, and other Central Banks, designed to address elevated pressures in short-term funding markets can be found here.Is the United States Losing Its Productivity Advantage? from the Federal Reserve Bank of New York can be found here.
| Foreign Trade | October | September | Y/Y | 2006 | 2005 | 2004 |
|---|---|---|---|---|---|---|
| U.S. Trade Deficit | $57.8B | $57.1B | $58.2B (10/06) |
$758.5 | $714.4B | $612.1B |
| Exports - Goods & Services | 0.9% | 0.8% | 13.7% | 12.7% | 10.9% | 13.7% |
| Imports - Goods & Services | 1.0% | 0.7% | 9.2% | 10.4% | 12.9% | 16.8% |
by Tom Moeller December 12, 2007
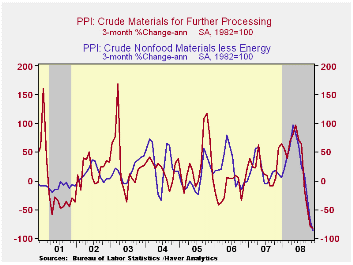
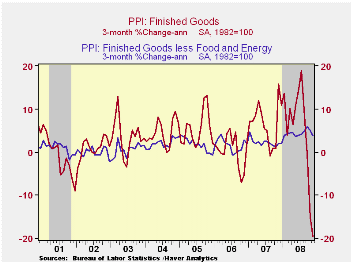
During November, another jump in petroleum prices raised
overall import prices by 2.7% after a 1.4% October increase. Consensus
expectations had been for a 2.4% gain.
Petroleum prices, overall, gained 18.0% (68.7% y/y). Fuel oil prices rose 18.0% (68.7% y/y) and crude petroleum prices rose 7.5% (53.0% y/y).
Less petroleum, import prices rose 0.7% after a 0.5% rise uptick during October.
During the last ten years there has been a 66% (negative) correlation between the nominal trade-weighted exchange value of the US dollar vs. major currencies and the y/y change in non oil import prices. The correlation is a reduced 47% against a broader basket of currencies. Why a Dollar Depreciation May Not Close the U.S. Trade Deficit from the Federal Reserve Bank of New York is available here
Prices for industrial supplies & materials excluding petroleum surged 2.7% (7.9% y/y). The detailed import price series can be found in the Haver USINT database.
Capital goods import prices rose 0.2% (0.8% y/y). Prices of computers, peripheral and semiconductors fell 0.2% (-5.1% y/y). Less the high tech sector, capital goods prices rose an accelerated 0.3% (3.2% y/y).
Prices for imports of consumer goods rose 0.2% (1.7% y/y) as apparel prices were unchanged after firm gains early this year (1.5% y/y). Prices for furniture and household items rose 0.2% (2.0% y/y).
Overall export prices were strong again and posted a 0.9% gain (6.1%y/y). Agricultural prices rose another strong 1.4% (23.0% y/y) while nonagricultural prices also were firm and rose 0.8% (4.6% y/y).
Global Savings, Investment and World Real Interest Rates is a 2007 working paper from the Royal Bank of Canada and it can be found here.
| Import/Export Prices (NSA) | November | October | Y/Y | 2006 | 2005 | 2004 |
|---|---|---|---|---|---|---|
| Import - All Commodities | 2.7% | 1.4% | 11.4% | 4.8% | 7.5% | 5.6% |
| Petroleum | 9.8% | 5.1% | 53.0% | 20.6% | 37.6% | 30.5% |
| Non-petroleum | 0.7% | 0.5% | 3.0% | 1.7% | 2.7% | 2.6% |
| Export- All Commodities | 0.9% | 0.8% | 6.1% | 3.6% | 3.2% | 3.9% |
by Robert Brusca December 12, 2007
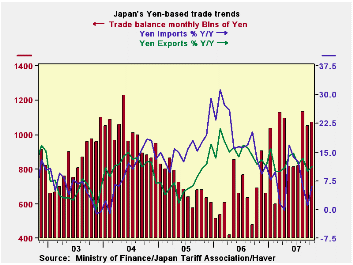
Japans exports and imports each show generally declining trends. Imports are up by just 4.4% year/year while exports are advancing at a pace of 11.4%. Japan’s services deficit is shrinking. Its good surplus and current account surplus are each widening. The current account surplus is widening in both dollar and yen terms (see table).
Recent macroeconomic data make it clear that Japan’s economy
is slowing. This is reflected in the import slowing that is in
progress. Japan’s imports fell by a sharp 6.3% in August then by 0.1%
in September before rebounding with a rise of 0.8% in October. Import
weakness is likely a reflection of the weakness in domestic demand.
| Japan Current Account Trends | |||||||
|---|---|---|---|---|---|---|---|
| In period level of % change | Average in period/or % change | ||||||
| Oct-07 | Sep-07 | Aug-07 | 3-Mo | 6-Mo | 12-Mo | 12-Mo Prev | |
| Current Account in $, Millions | $ 22,135 | $ 19,489 | $ 18,789 | $ 20,138 | $ 18,303 | $ 17,425 | $ 14,049 |
| In Yen, 100 Millions | |||||||
| Overall Balance | 25,648 | 22,420 | 21,932 | 23,333 | 21,680 | 20,641 | 16,375 |
| Services Balance | (365) | (1,546) | (2,286) | (1,399) | (1,790) | (1,929) | (1,789) |
| Balance on Goods | 13,141 | 10,704 | 14,404 | 12,750 | 10,877 | 10,651 | 7,471 |
| % m/m | % SAAR | ||||||
| Export Goods % | 4.4% | -5.4% | 3.4% | 8.1% | 16.0% | 11.8% | 24.4% |
| Import Goods % | 0.8% | -0.1% | -6.3% | -18.8% | 10.9% | 4.4% | 16.4% |
| Prices in %, SAAR | |||||||
| Export Prices | 0.8% | -0.7% | -3.2% | -16.7% | -1.5% | -0.1% | 4.7% |
| Import Prices | 4.4% | -1.4% | -2.5% | -2.1% | 11.1% | 7.5% | 20.5% |
| Memo: Yen/$, AVG, Level | 115.87 | 115.04 | 116.73 | 115.88 | 118.75 | 118.69 | 116.54 |

Tom Moeller
AuthorMore in Author Profile »Prior to joining Haver Analytics in 2000, Mr. Moeller worked as the Economist at Chancellor Capital Management from 1985 to 1999. There, he developed comprehensive economic forecasts and interpreted economic data for equity and fixed income portfolio managers. Also at Chancellor, Mr. Moeller worked as an equity analyst and was responsible for researching and rating companies in the economically sensitive automobile and housing industries for investment in Chancellor’s equity portfolio. Prior to joining Chancellor, Mr. Moeller was an Economist at Citibank from 1979 to 1984. He also analyzed pricing behavior in the metals industry for the Council on Wage and Price Stability in Washington, D.C. In 1999, Mr. Moeller received the award for most accurate forecast from the Forecasters' Club of New York. From 1990 to 1992 he was President of the New York Association for Business Economists. Mr. Moeller earned an M.B.A. in Finance from Fordham University, where he graduated in 1987. He holds a Bachelor of Arts in Economics from George Washington University.
More Economy in Brief


