 Global| Sep 11 2007
U.S. Trade Deficit Continued to Narrow
by:Tom Moeller
|in:Economy in Brief
Summary
The U.S. foreign trade deficit narrowed very slightly in July to $59.2B from a little revised $59.4B in June. The figure was quite near Consensus expectations for a deficit of $59.0B. While only a small improvement, the average [...]
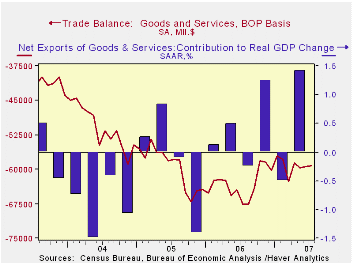
The U.S. foreign trade deficit narrowed very slightly in July to $59.2B from a little revised $59.4B in June. The figure was quite near Consensus expectations for a deficit of $59.0B. While only a small improvement, the average deficit of $59.4 during the last eight months compares to an average of $64.8B during the prior twelve.
Much of the narrowing of the deficit owes to strength in U.S. exports which rose 2.7% (14.8% y/y). Exports of non-auto consumer goods rose 4.2% (13.2% y/y) while exports of capital goods surged 5.3% (13.8% y/y). Advanced technology goods exports slipped 8.6% but the y/y gain of 13.2% suggests some strength. Exports of autos and products rose 14.6% m/m and a blazing 20.9% y/y.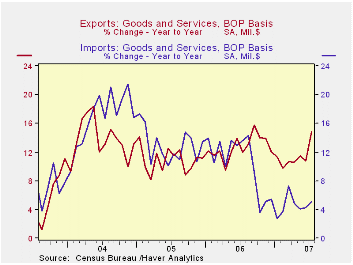
Overall imports rose 1.6% but imports of nonpetroleum products rose 1.6% (4.3%% y/y). The slower gain versus exports is clearly due to the relative performance of the U.S. (weak) and foreign (strong) economies. Imports of nonauto consumer goods increased 1.1% (7.5% y/y) while capital goods imports slipped 0.3% (+5.4% y/y). Imports of advanced technology products fell 1.6% (+12.2% y/y).
The value of petroleum product imports fell 3.4% (-3.8% y/y) but the price of Brent crude oil rose to $75.9.
The U.S. trade deficit in goods with China deepened sharply m/m to $23.8B and versus a deficit of $19.6 the prior July.
| Foreign Trade | July | June | Y/Y | 2006 | 2005 | 2004 |
|---|---|---|---|---|---|---|
| U.S. Trade Deficit | $59.2B | $59.4B | $67.6B (7/06) |
$758.5 | $714.4B | $612.1B |
| Exports - Goods & Services | 2.7% | 1.3% | 14.8% | 12.7% | 10.9% | 13.7% |
| Imports - Goods & Services | 1.8% | 0.8% | 5.1% | 10.4% | 12.9% | 16.8% |
by Tom Moeller September 11, 2007
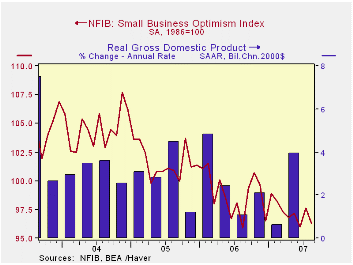
The index of small business optimism in August fell to a low 96.3 in August versus 97.6 during July, according to the National Federation of Independent Business (NFIB).
During the last ten years there has been a 70% correlation between the level of the NFIB index and the two quarter change in real GDP.
Respondents expecting the economy to improve improved after sharp deterioration during the prior several months but the percentage of firms with job openings improved modestly.
During the last ten years there has been a 72% correlation between the NFIB percentage and the y/y change in nonfarm payrolls.
The percent planning to raise capital expenditures was unchanged from a low level in July.
The percentage of firms actually raising prices fell sharply. During the last ten years there has been a 60% correlation between the change in the producer price index and the level of the NFIB price index. The percentage of firms planning to raise prices also fell.
About 24 million businesses exist in the United States. Small business creates 80% of all new jobs in America.
Outlook and Risks for the U.S. Economy by Federal Reserve Board governor Frederic is available here.
| Nat'l Federation of Independent Business | August | July | Y/Y | 2006 | 2005 | 2004 |
|---|---|---|---|---|---|---|
| Small Business Optimism Index (1986=100) | 96.3 | 97.6 | 0.4% | 98.9 | 101.6 | 104.6 |
by Tom Moeller September 11, 2007
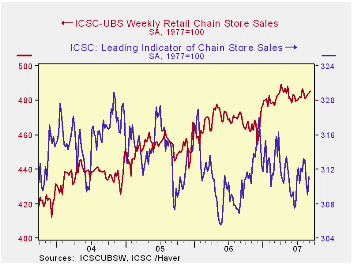
The ICSC-UBS retail chain-store sales index is constructed using the same-store sales (stores open for one year) reported by 78 stores of seven retailers: Dayton Hudson, Federated, Kmart, May, J.C. Penney, Sears and Wal-Mart.
The leading indicator of chain store sales from ICSC-UBS rose 0.7% is up a small 0.9% y/y.
| ICSC-UBS (SA, 1977=100) | 09/08/07 | 09/01/07 | Y/Y | 2006 | 2005 | 2004 |
|---|---|---|---|---|---|---|
| Total Weekly Chain Store Sales | 485.6 | 484.3 | 2.9% | 3.3% | 3.6% | 4.7% |
by Louise Curley September 11, 2007

China's trade surplus rose to $24,974 million in August. the second highest on record. The trade surplus with the United States was $15,003 million and that was an all time high. The total surplus and that with the U.S. are shown in the first chart. (These are the data that are quoted in the press. They are not seasonally adjusted. Haver adjusts the data for seasonality and the occurrence of the Chinese New Year for China in the EMERGEPR data base. The adjusted data are shown in the second chart.)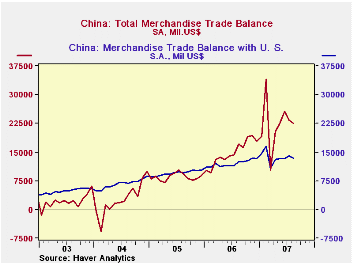
While the unrelenting increases in the surplus with the United States are causing increased tension between the two countries, it should be noted that the gap between the total surplus and that with the US is widening, indicating that surpluses with some other countries are increasing faster than that with the U. S. In August, China's surplus with Europe, for example, was at an all time high of $12,744 million and it has been rising faster that that of the U. S., as can be seen in the third chart.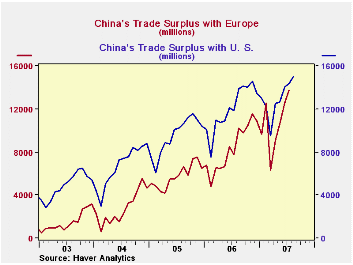
Much of the China trade data can be found in either of the CHINA or the EMERGEPR data bases. In some cases one may be more up to date than the other or one might have more detail. For example, August data for the trade balance with Europe are available in the EMERGEPR data base but not in the CHINA data base. Although not so up to date as EMERGEPR in this instance, CHINA has far more country detail than the former.
| CHINA: TRADE IN GOODS | Aug 07 | Jul 07 | Jun 07 | May 07 | Apr 07 | 2006 | 2005 | 2004 |
|---|---|---|---|---|---|---|---|---|
| Total Trade Balance (Bil US$) | 25.0 | 24.4 | 26.9 | 22.4 | 16.8 | 177.5 | 102.0 | 32.1 |
| Balance with the U. S. (Bil US$) | 15.0 | 14.4 | 14.1 | 12.6 | 12.5 | 144.3 | 114.2 | 80.3 |
| Year over year Percent Change | 8.0 | 21.1 | 16.2 | 16.0 | 16.7 | 26.4 | 42.2 | 37.0 |
| Balance with Europe (Bil US$) | 12.8 | 12.2 | 12.5 | 10.6 | 9.1 | 100.4 | 69.3 | 33.6 |
| Year over year Percent Change | 24.6 | 77.0 | 46.9 | 59.6 | 77.0 | 45.0 | 105.9 | 82.9 |
by Robert Brusca September 11, 2007
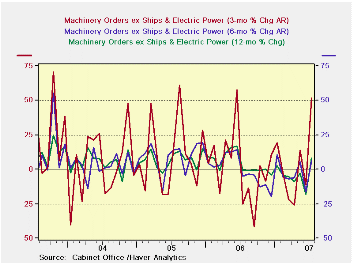
Japan sticks with the notion that it is still growing and that orders are generally expanding, but moving more or less sideways. Recent Japan macro data have been touch-and-go. In contrast the July core machinery orders reading is fairly strong. The rebound dominates the decline posted in June. Still, Japan’s officials view this as a sideways movement. Orders -- even core orders -- that remove large contracts from ship building and electric power are still quite lumpy. The Yr/Yr growth of orders tends to dampen the impact of the lumps; it shows growth at a firm 8.4%. Orders related to domestic demand are growing at a pace of 5%. Foreign orders are still the source of strength, up by 12.6% Yr/Yr.
| M/M % | SAAR % | |||||
| SA | Jul-07 | Jun-07 | May-07 | 3-Mos | 6-Mos | 12-Mos |
| Total | -0.6% | -6.5% | 5.8% | -6.5% | -2.5% | 7.9% |
| Core Orders* | 17.0% | -10.4% | 5.9% | 51.9% | 6.1% | 8.4% |
| Total Orders | ||||||
| Foreign Demand | -10.8% | -5.9% | 5.5% | -38.5% | -6.6% | 12.6% |
| Domestic Demand | 6.7% | -6.5% | 5.9% | 24.9% | -2.8% | 5.0% |
| * Excluding ships and electric power | ||||||
by Robert Brusca September 11, 2007
French import growth is persistently outstripping exports.
Exports ground to a halt in July as imports rose by 0.7%. Over three months, six months and twelve months, export growth is lagging import growth. Both flows however are showing accelerating and quite solid growth overall. Still there are exceptions. On the export side both capital goods and motor vehicle flows have come up lame over the past three months. Only a surge in consumer goods exports compensated for the weakness. For imports all major types of flows are still accelerating. France’s erratic reading in July for exports does dove tail with the previously reported weakness in German export orders in July. We are still trying to assess what the prospect for growth is in the face of such uneven results. On the other hand the strength in French imports seems to be a powerful sign that French domestic demand is still strong and that its domestic sources of growth are underpinned.
| M/M% | % SAAR | ||||
| Jul-07 | Jun-07 | 3-M | 6-M | 12-M | |
| Balance* | -€€ 3,304.00 | -€€ 3,145.00 | -€€ 3,258.67 | -€€ 2,833.67 | -€€ 2,531.08 |
| Exports | |||||
| All Exports | 0.0% | 4.6% | 9.6% | 7.9% | 5.1% |
| Capital Goods | -1.6% | 4.5% | -11.3% | 2.6% | 0.3% |
| Motor Vehicles | -1.2% | 3.2% | -8.9% | 0.6% | -2.5% |
| Consumer Goods | 4.6% | 3.3% | 32.4% | 15.3% | 9.5% |
| Imports | |||||
| All Imports | 0.7% | 4.0% | 16.9% | 16.5% | 6.1% |
| Capital Goods | 2.1% | 4.4% | 36.3% | 11.1% | 6.5% |
| Motor Vehicles | 0.5% | 5.2% | 18.2% | 15.2% | 12.8% |
| Consumer Goods | 0.1% | 4.0% | 14.2% | 10.5% | 4.8% |
| *Mil Euros; monthly or period average | |||||
by Robert Brusca September 11, 2007
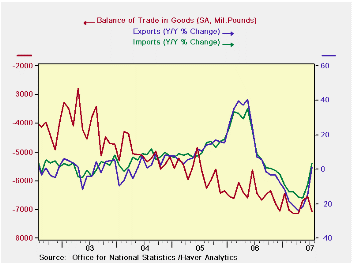
UK trade deficit widens in July as worsening trend stays in place.
Trade flows in capital goods and autos are strengthening. But imports are generally holding their lead forcing the deficit deeper into red ink. Export and import flows generally have accelerated in the last 3 months and 6 months compared to earlier periods in terms of the sequential growth rates in the table below. The UK trade deficit has sunk to -7 billion sterling in July from -6.5 billions sterling in June. UK trade flows are just starting to get back into a normal swing after a huge surge in early 2006.
| m/m% | % SAAR | ||||
| Jul-07 | Jun-07 | 3M | 6M | 12M | |
| Balance* | -££ 7.07 | -££ 6.54 | -££ 6.76 | -££ 6.93 | -££ 6.78 |
| Exports | |||||
| All Exports | 2.6% | 3.1% | 48.6% | 12.1% | 1.4% |
| Capital Goods | 7.3% | 4.8% | 89.7% | 13.0% | -17.8% |
| Road Vehicles | 2.7% | 4.6% | 28.9% | 11.8% | 14.7% |
| Basic Materials | -5.1% | -1.0% | -2.5% | 34.8% | 13.6% |
| Food Feed Beverages & Tobacco | 1.2% | -4.5% | 24.9% | 2.7% | 8.8% |
| Imports | |||||
| All Improts | 4.0% | 1.6% | 31.8% | 14.2% | 3.6% |
| Capital Goods | 1.6% | 3.2% | 18.2% | 2.2% | -17.5% |
| Road Vehicles | 1.3% | 2.2% | 51.0% | 9.2% | 20.6% |
| Basic Materials | 7.1% | 2.7% | 62.9% | 76.7% | 46.1% |
| Food Feed Beverages & Tobacco | 4.7% | -2.2% | 7.5% | 6.2% | 10.0% |
| *Bil Sterling; monthly or period average | |||||

Tom Moeller
AuthorMore in Author Profile »Prior to joining Haver Analytics in 2000, Mr. Moeller worked as the Economist at Chancellor Capital Management from 1985 to 1999. There, he developed comprehensive economic forecasts and interpreted economic data for equity and fixed income portfolio managers. Also at Chancellor, Mr. Moeller worked as an equity analyst and was responsible for researching and rating companies in the economically sensitive automobile and housing industries for investment in Chancellor’s equity portfolio. Prior to joining Chancellor, Mr. Moeller was an Economist at Citibank from 1979 to 1984. He also analyzed pricing behavior in the metals industry for the Council on Wage and Price Stability in Washington, D.C. In 1999, Mr. Moeller received the award for most accurate forecast from the Forecasters' Club of New York. From 1990 to 1992 he was President of the New York Association for Business Economists. Mr. Moeller earned an M.B.A. in Finance from Fordham University, where he graduated in 1987. He holds a Bachelor of Arts in Economics from George Washington University.
More Economy in Brief


