 Global| Aug 12 2008
U.S. Trade Deficit Again Unexpectedly Narrowed As Exports Surged
by:Tom Moeller
|in:Economy in Brief
Summary
During June, the U.S. foreign trade deficit narrowed again to $56.8B after shrinking to the little-revised $59.2B in May. A deficit of $61.9B had been the Consensus expectation for June. So far this year the monthly trade deficit has [...]
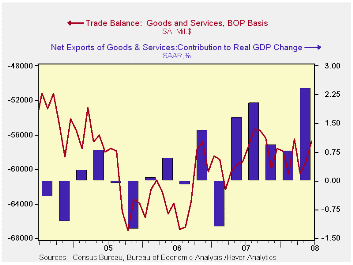
During June, the U.S. foreign trade deficit narrowed again to
$56.8B after shrinking to the little-revised $59.2B in May. A deficit
of $61.9B had been the Consensus expectation for June. So far this year
the monthly trade deficit has averaged $58.6B versus $59.7B during the
first six months of 2007.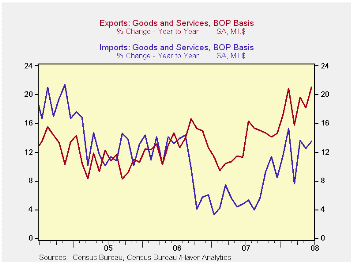
In constant dollars the picture is even more encouraging. The trade deficit in goods narrowed to $39.1B from $43.5B in May and in 2008 the real deficit has narrowed by more than $10B to an average $46.3B. For the second quarter, the initial estimate indicated that the narrower trade deficit added 2.4 percentage points to real GDP growth, a figure that should be revised up. That was after additions between 0.8 and 1.4 percentage points during the prior three quarters.
U.S. exports surged 4.0% m/m during June after an upwardly revised 1.2% increase in May. Annualized, exports have risen at a 26.6% annualized rate during the last six months versus 13.0% growth during 2006 and 2007.
Goods exports rose 5.1% during June after an upwardly revised
0.9% gain in May. Adjusted for prices, chained dollar exports rose 4.0%
(13.4% y/y). Real exports of nonauto consumer goods jumped 5.3% (16.7%
y/y) after a 0.2% dip during May. Exports of capital goods also were
strong and rose 3.0% (10.1% y/y). Exports of autos, parts &
engines surged 5.7% (7.4% y/y) while real exports foods, feeds
& beverages jumped 5.9% (19.2% y/y).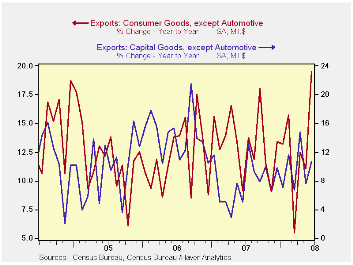
Exports of services rose 1.4% (16.7% y/y) and that followed an upwardly revised 2.0% jump during May. Travel exports rose 0.6% (21.9% y/y) while passenger fares surged again, in June by 4.4% (33.4% y/y).
Petroleum imports did bounce back in June by 14.6% after the
modest decline during May. However, adjusted for the higher prices,
petroleum imports recovered only half of their May decline with a 4.8%
(-8.3% y/y) increase. The quantity of energy-related imports of
petroleum products fell 7.6% y/y while the average cost for a barrel of
crude oil was $117.13 (92.0% y/y) in June.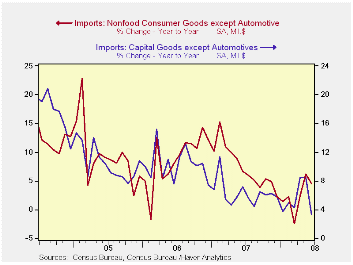
Month-to-month, imports of nonpetroleum products fell 1.4% during June. Measured in chained 2000 dollars these imports fell 0.6% (-3.9% y/y) after a revised 1.9% plop during May. In chained dollars imports of capital goods surged cratered by 3.4% (+1.4% y/y). Chained imports of nonauto consumer goods also fell a hard 1.6% (+0.7% y/y) after a 3.9% May pop. Real imports of automotive vehicles & parts ticked up 0.3% (-6.7% y/y) following their 4.6% drop during May.
Services imports increased 1.0% (9.9% y/y). Travel imports ticked lower by 0.1% (+9.4% y/y) while passenger fares rose 4.4% (18.2% y/y).
With China, the U.S. trade deficit in goods was roughly steady m/m at $21.4B. The deficit with China during the first six months of this year is the same as during last year's first six months. Exports to China rose 8.5% y/y during June and import growth moderated to just 2.9%. With Japan the trade deficit deepened to $6.1B as exports fell 3.2% (+10.3% y/y) and imports rose 7.9% (2.5% y/y).
Challenging Times... from the Federal Reserve Bank of Kansas City is available here.
The Evolution of the World Income Distribution from the Federal Reserve Bank of Philadelphia can be found here.
| Foreign Trade | June | May | Y/Y | 2007 | 2006 | 2005 |
|---|---|---|---|---|---|---|
| U.S. Trade Deficit | $56.8B | $59.2B | $59.1B (6/07) | $700.3 | $753.3 | $711.6B |
| Exports - Goods & Services | 4.0% | 1.2% | 21.1% | 13.0% | 13.5% | 10.6% |
| Imports - Goods & Services | 1.8% | 0.3% | 13.5% | 6.1% | 10.8% | 12.8% |
| Petroleum | 14.6% | -1.8% | 67.7% | 9.4% | 20.1% | 39.6% |
| Nonpetroleum Goods | -1.4% | 1.2% | 3.8% | 4.8% | 9.1% | 10.3% |
by Tom Moeller August 12, 2008
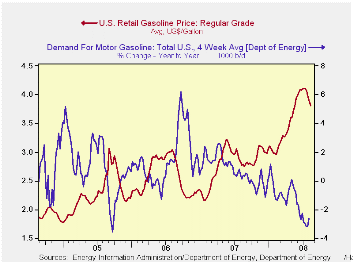
The pump price for a gallon of regular gasoline repeated the prior week's decline and fell seven cents last week to $3.81 per gallon, according to the U.S. Department of Energy survey. The price has now fallen by 30 cents, or 7.4%, from the peak five weeks ago. Last week's price for a gallon of regular gas was the lowest since late-May. For all grades of gasoline the average price fell another seven cents to $3.86 per gallon.
Yesterday the spot market price for a gallon of regular gasoline fell another two cents, from Friday, to $2.82 per gallon. That was versus last week's average of $2.92..
Weekly gasoline prices can be found in Haver's WEEKLY
database, daily prices are in the DAILY
database.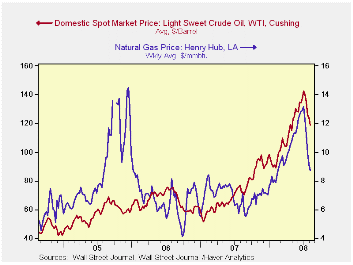
According to the U.S. Department of Energy, though the demand for gasoline rose slightly w/w but demand during the latest four weeks fell 2.6% from a year earlier. That y/y decline nearly equaled the decline in gasoline demand three years ago when Hurricane Katrina struck and it limited gasoline supplies.
The DOE figures are available in Haver's OILWKLY database.
The price for a barrel of West Texas Intermediate crude oil fell last week to an average $118.88 per barrel. That's down from the high early last week of 142.46.
Prices for natural gas fell again w/w to an average $8.69 per mmbtu (+36.1% y/y). The high for natural gas prices was five weeks ago at $13.19/mmbtu.
What Is the Optimal Inflation Rate? from the Federal Reserve Bank of Kansas City is available here.
Divorcing Money from Monetary Policy from the Federal Reserve Bank of New York can be found here.
| Weekly Prices | 08/11/08 | 08/04/08 | Y/Y | 2007 | 2006 | 2005 |
|---|---|---|---|---|---|---|
| Retail Regular Gasoline ($ per Gallon) | 3.81 | 3.88 | 37.5% | 2.80 | 2.57 | 2.27 |
| Light Sweet Crude Oil, WTI ($ per bbl.) | 118.88 | 123.84 | 65.2% | 72.25 | 66.12 | 56.60 |
by Tom Moeller August 12, 2008
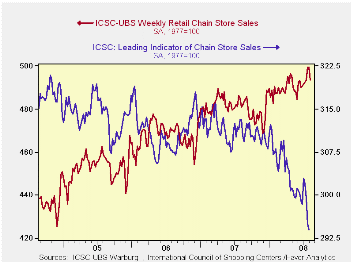
According to the International Council of Shopping Centers chain store sales fell 0.2% last week and that was enough to return the level of sales to where it was in the third week of June. Sales were still up 0.4% from the June average after that month's 0.5% rise.
During the last ten years there has been a 45% correlation between the y/y change in chain store sales and the change in nonauto retail sales less gasoline.The ICSC-UBS retail chain-store sales index is constructed using the same-store sales (stores open for one year) reported by 78 stores of seven retailers: Dayton Hudson, Federated, Kmart, May, J.C. Penney, Sears and Wal-Mart.
The leading indicator of chain store sales from ICSC-UBS slipped again by 0.3% (-6.1% y/y) after the 1.5% decline during the week prior.
The chain store sales figures are available in Haver's SURVEYW database.
Signal or Noise? Implications of the Term Premium for Recession Forecasting from the Federal Reserve Bank of New York is available here.
The Industrial evolution and the Demographic Transition from the Federal Reserve Bank of Philadelphia can be found here.
| ICSC-UBS (SA, 1977=100) | 08/09/08 | 08/02/08 | Y/Y | 2007 | 2006 | 2005 |
|---|---|---|---|---|---|---|
| Total Weekly Chain Store Sales | 493.5 | 499.2 | 2.6% | 2.8% | 3.3% | 3.6% |
by Tom Moeller August 12, 2008
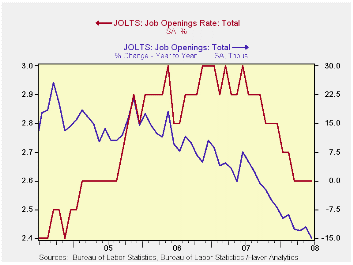
For June, the Bureau of Labor Statistics reported in the Job Openings & Labor Turnover Survey (JOLTS) reported that the number of job openings ticked down 0.1% (-15.0% y/y) from May. The dip followed a 0.5% gain during May. Since their peak in January of 2007, the number of job openings have fallen 14%.
The job openings rate was unchanged during June at 2.6%. The latest figures are down from near 3% one year ago. The job openings rate is the number of job openings on the last business day of the month as a percent of total employment plus job openings.
The actual number of job openings in the manufacturing sector rose 0.4% (-25.6% y/y) in June from an upwardly revised May figure. Professional & business services job openings recovered declines during the prior two months with a 9.9% (-0.6% y/y) increase. Job openings in the education & health sectors rose by 6.3% (-2.8% y/y) after three consecutive months of decline but job openings in retail trade reversed the May increase with a 10.5% (-21.5% y/y) drop.
By region, openings in the West were off by one quarter from the year ago level. In the South they fell 11.2% y/y and in the Midwest openings fell a like 11.9%. In the Northeast job openings also fell 8.5% y/y
The hires rate ticked up to 3.1% but remained near the low for this cycle.The hires rate is the number of hires during the month divided by employment.The latest figure was near the lowest since 2003. The actual number of hires rose 5.1% (-10.5% y/y). Hires in the trade & transportation sectors rose sharply m/m but remained down 4.6% from one year earlier.
The job separations rate held stable m/m at 3.1%, down from 3.7% at the peak. Separations include quits, layoffs, discharges, and other separations as well as retirements. The level of job separations fell 3.5% y/y.
The JOLTS survey dates only to December 2000 but has since followed the movement in nonfarm payrolls, though the actual correlation between the two series is low.
A description of the Jolts survey and the latest release from the U.S. Department of Labor is available here.
| JOLTS (Job Openings & Labor Turnover Survey) | June | May | June '07 | 2007 | 2006 | 2005 |
|---|---|---|---|---|---|---|
| Job Openings, Total | ||||||
| Rate (%) | 2.6 | 2.6 | 3.0 | 2.8 | 3.0 | 2.8 |
| Total (000s) | 3,627 | 3,631 | 4,267 | 3,974 | 4,272 | 3,863 |
| Hires, Total | ||||||
| Rate (%) | 3.1 | 3.0 | 3.5 | 41.9 | 43.4 | 43.1 |
| Total (000s) | 4,333 | 4,123 | 4,843 | 57,771 | 59,153 | 57,501 |
by Tom Moeller August 12, 2008
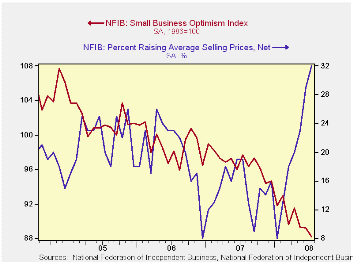
Small business optimism, according to the National Federation of Independent Business (NFIB), fell another 1.1% last month after having been roughly unchanged in June. The index was near the low in 1975 which was its second lowest level on record.
During the last ten years there has been a 70% correlation between the level of the NFIB index and the two quarter change in real GDP.
The percentage of respondents with one or more job openings
revered most of the June improvement while the percent expecting the
economy to improve rose slightly. Seventeen percent of respondents had
one or more job openings. During the last ten years there has been a
71% correlation between the NFIB employment percentage and the y/y
change in nonfarm payrolls. The percentage planning to raise employment
was level m/m at 5%, near the least since early-2003.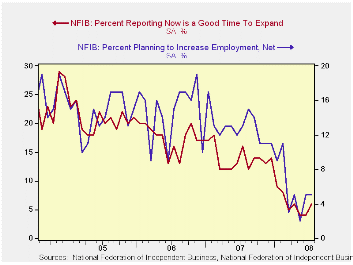
Six percent of respondents thought that now was a good time to expand the business, the least since 1982, and 37% of respondents expected lower earnings, a record low.
The percentage of firms actually raising prices shot up to 32%, the highest level since 1981. During the last ten years there has been a 64% correlation between the y/y change in the producer price index and the level of the NFIB price index. The percentage of firms planning to raise prices also surged to 38%, also its highest since 1981.
About 24 million businesses exist in the United States. Small business creates 80% of all new jobs in America.
The NFIB figures can be found in Haver's SURVEYS database.
| Nat'l Federation of Independent Business | July | June | Y/Y | 2007 | 2006 | 2005 |
|---|---|---|---|---|---|---|
| Small Business Optimism Index (1986=100) | 88.2 | 89.2 | -9.6% | 96.7 | 98.9 | 101.6 |
by Louise Curley August 12, 2008
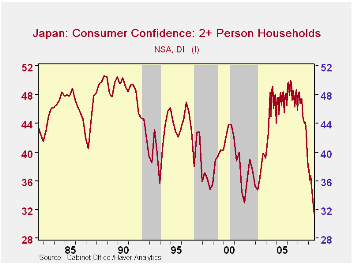
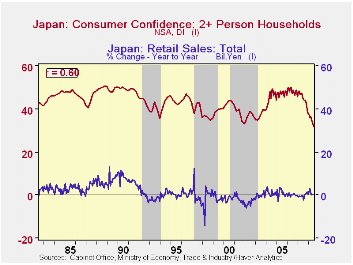
Consumer confidence in Japan, as measured by a diffusion index, declined again in July and was at the lowest level recorded since June 1982 when confidence was first measured. The history of the index is shown in the first chart. Monthly data are available only since April, 2004 and these, only on a seasonally unadjusted basis. The index was 31.4 in July.
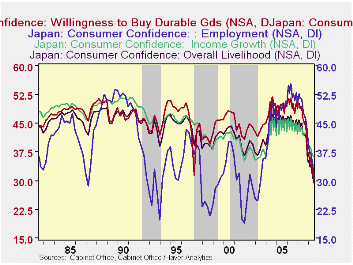
The index is the average of opinions regarding the consumers' overall livelihood, the growth of income, employment prospects and their willingness to buy durable goods. Opinions on all four have deteriorated since early 2007 and, except for the employment prospects are at all time lows, as shown in the second chart. Opinions on employment prospects have been more volatile than those on the other components of the index.
Retail sales for June were also released today. The year over year changes in retail sales in the last three months have been close to zero: 0.29% in June, 0.27% in May and 0.05% in April. The relation of consumer confidence to actual retail sales is not very strong as can be seen in the third chart that correlates consumer confidence with the year to year change in retail spending. The R2 is .36 indicating that consumer confidence explains only 36% of the year to year changes in retail sales. While low confidence might suggest lower spending, it may be that the rationale goes the other way. The acceleration in the prices of food and beverages since the beginning of the year, shown in the table below, has probably played a major role in weakening confidence.
| JAPAN | Jul 08 | Jun 08 | May 08 | Apr 08 | Mar 08 | Feb 08 | Jan 08 | 2007 |
|---|---|---|---|---|---|---|---|---|
| Consumer Confidence Diffusion Index (%) | 31.4 | 32.6 | 33.9 | 35.2 | 36.7 | 36.1 | 37.5 | 44.7 |
| Overall livelihood | 29.3 | 30.3 | 31.5 | 33.0 | 34.4 | 33.7 | 35.1 | 42.2 |
| Income growth | 36.3 | 36.5 | 36.6 | .7.5 | 38.7 | 38.5 | 39.4 | 42.6 |
| Employment | 30.7 | 32.8 | 34.9 | 36.0 | 37.6 | 37.0 | 38.6 | 48.1 |
| Willingness to buy durable goods | 29.2 | 30.9 | 32.7 | 34.2 | 36.2 | 34.8 | 36.7 | 45.7 |
| CPI: Food & Beverage (Y/Y % ) | 3.59 | 2.38 | 1.99 | 1.54 | 1.20 | 0.50 | 0.34 | |
| Retail Sales (Y/Y % ) | 0.27 | 0.29 | 0.05 | 1.04 | 3.17 | 1.31 | -0.13 |

Tom Moeller
AuthorMore in Author Profile »Prior to joining Haver Analytics in 2000, Mr. Moeller worked as the Economist at Chancellor Capital Management from 1985 to 1999. There, he developed comprehensive economic forecasts and interpreted economic data for equity and fixed income portfolio managers. Also at Chancellor, Mr. Moeller worked as an equity analyst and was responsible for researching and rating companies in the economically sensitive automobile and housing industries for investment in Chancellor’s equity portfolio. Prior to joining Chancellor, Mr. Moeller was an Economist at Citibank from 1979 to 1984. He also analyzed pricing behavior in the metals industry for the Council on Wage and Price Stability in Washington, D.C. In 1999, Mr. Moeller received the award for most accurate forecast from the Forecasters' Club of New York. From 1990 to 1992 he was President of the New York Association for Business Economists. Mr. Moeller earned an M.B.A. in Finance from Fordham University, where he graduated in 1987. He holds a Bachelor of Arts in Economics from George Washington University.
More Economy in Brief


