Global| Jun 20 2002
U.S. Trade Deficit a Record in April
by:Tom Moeller
|in:Economy in Brief
Summary
The U.S. foreign trade deficit deepened more than expected in April. March's deficit was revised deeper as were deficits for prior years. The trade deficit in 1Q averaged $31.6B, deeper than originally estimated. The degree of [...]

The U.S. foreign trade deficit deepened more than expected in April. March's deficit was revised deeper as were deficits for prior years.
The trade deficit in 1Q averaged $31.6B, deeper than originally estimated. The degree of deterioration versus 4Q01 was lessened since the 4Q deficit was revised more.
Imports rose sharply as imports of industrial supplies were boosted by higher oil prices and quantities. Imports of nonauto capital goods rose 1.5%, the fourth strong consecutive monthly increase. Imports of nonauto consumer goods also were strong for the third month in four. Automotive imports also surged.
Exports rose sharply due to across-the-board gains except for capital goods (-12.9% y/y) that were unchanged and food.
| Foreign Trade | April | Mar | Y/Y | 2001 | 2000 | 1999 |
|---|---|---|---|---|---|---|
| Trade Deficit | $35.9B | $32.5B | $32.4B(4/01) | $358.3B | $378.7B | $261.8B |
| Exports - Goods & Services | 2.2% | 1.2% | -7.2% | -6.2% | 11.2% | 2.6% |
| Imports - Goods & Services | 4.7% | 0.5% | -2.2% | -6.0% | 18.3% | 10.9% |
by Tom Moeller June 20, 2002

The US current account deficit deepened sharply last quarter to a record level. The deterioration versus 4Q01 was greater than expected. Prior year's figures were revised.
A record deficit in goods, services and income trade was driven by sharp deterioration in goods and services trade while a surplus in the income balance swung to deficit.
Exports of goods and services rose slightly for the first gain in six quarters but income receipts fell sharply for the fifth straight quarter.
| US Int'l Balance of Payments | 1Q '02 | 4Q '01 | Y/Y | 2001 | 2000 | 1999 |
|---|---|---|---|---|---|---|
| Current Account Deficit | $112.5B | $95.1B | $116.3B | $417.4B | $444.7B | $324.4B |
| % of GDP | 4.3% | 3.7% | 4.3% | 3.9% | 4.2% | 3.2% |
| Deficit on Gds, Serv & Income | $96.6B | $81.5B | $96.1B | $343.9B | $356.9B | $244.1B |
| Exports | -0.1% | -5.8% | -16.5% | -9.6% | 13.6% | 4.7% |
| Imports | 4.0% | -3.9% | -12.8% | -8.4% | 18.9% | 10.4% |
| Unilateral Transfers Deficit | $15.9B | $13.6B | $11.6B | $49.5B | $53.4B | $48.8B |
by Tom Moeller June 20, 2002

The Composite Index of Leading Economic Indicators rose more than expected last month to a new high. The April decline was lessened slightly.
The ratio of coincident to lagging indicators rose sharply, an indication that excesses in the economy are falling relative to the economy's actual performance.
60% of the leaders' component series rose last month versus only 40% rising in April. A decline in claims for jobless insurance and a rise in the money supply had the largest positive influence.
The Leading index is based on eight previously reported economic data series and two that are estimated.
| Business Cycle Indicators | May | April | Y/Y | 2001 | 2000 | 1999 |
|---|---|---|---|---|---|---|
| Leading | 0.4% | -0.3% | 2.7% | -0.6% | 1.0% | 3.3% |
| Coincident | 0.1% | 0.0% | -0.3% | 0.3% | 3.4% | 3.2% |
| Lagging | -0.2% | -0.5% | -5.5% | -1.3% | 2.8% | 1.8% |
by Tom Moeller June 20, 2002
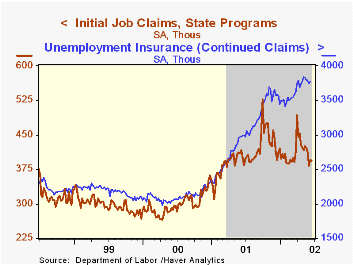
Initial claims for unemployment insurance fell slightly in the latest week, about as expected. The prior week's level was revised up.
The latest claims data is for the June survey period for nonfarm payrolls. Initial claims are down 29,000 versus the May period, a decline influenced by the expiration of the extended benefits program
Continuing claims for unemployment insurance rose for the first week in five. The prior week's level was revised down sharply.
The four-week moving average of initial claims fell to 396,250, -3.2% y/y.
The insured rate of unemployment was stable at 2.9%.
| Unemployment Insurance (000s) | 6/15/02 | 6/8/02 | Y/Y | 2001 | 2000 | 1999 |
|---|---|---|---|---|---|---|
| Initial Claims | 393.0 | 395.0 | -1.3% | 405.8 | 299.8 | 297.7 |
| Continuing Claims | -- | 3,775 | 26.6% | 3,021 | 2,114 | 2,186 |
by Tom Moeller June 20, 2002
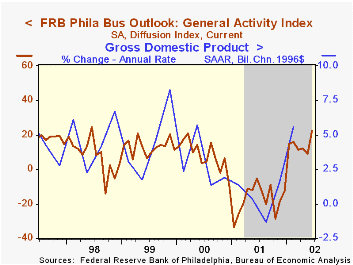
The Philadelphia Fed’s index of general business conditions for June surged more than expected to its highest level since June 1998.
New and unfilled orders surged while inventories fell at a lesser rate. Delivery lead times lengthened for only the third month this year.
The business conditions index reflects a separate survey question, not the components.
Pricing pressure firmed to the highest level since September 2000.
| Philadelphia Fed Business Outlook | June | May | Y/Y | 2001 | 2000 | 1999 |
|---|---|---|---|---|---|---|
| General Activity Index | 22.2 | 9.1 | -5.0 | -17.3 | 8.2 | 13.3 |
| Prices Paid Index | 22.9 | 19.7 | 16.5 | -1.0 | 27.1 | 10.0 |
by Tom Moeller June 20, 2002
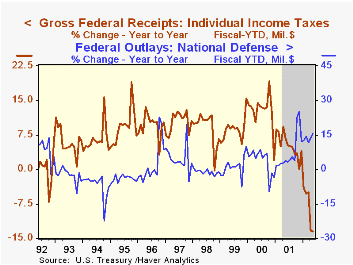
The US budget deteriorated somewhat more than expected last month. May's fiscal YTD deficit was the largest since 1994.
Receipts fell sharply m/m following tax filings on April 15. Fiscal YTD individual income taxes were down 20.4% versus last year, reflecting higher unemployment. Fiscal YTD corporate taxes fell 17.1% versus last year.
Growth in expenditures remained strong lifted by higher spending on defense (15.7% YTD), education (15.6% YTD) and income security (17.9% YTD).
| US Government Finance | May | April | Fiscal YTD | 2001 | 2000 | 1999 |
|---|---|---|---|---|---|---|
| Budget Balance | $-80.6B | $67.2B | $-147.1B | $127.2B | $236.9B | $124.4B |
| Revenues | $102.5B | $137.4B | -11.6% | -1.7% | 10.8% | 6.1% |
| Outlays | $183.1B | $170.3B | 10.0% | 4.2% | 5.0% | 3.1% |

Tom Moeller
AuthorMore in Author Profile »Prior to joining Haver Analytics in 2000, Mr. Moeller worked as the Economist at Chancellor Capital Management from 1985 to 1999. There, he developed comprehensive economic forecasts and interpreted economic data for equity and fixed income portfolio managers. Also at Chancellor, Mr. Moeller worked as an equity analyst and was responsible for researching and rating companies in the economically sensitive automobile and housing industries for investment in Chancellor’s equity portfolio. Prior to joining Chancellor, Mr. Moeller was an Economist at Citibank from 1979 to 1984. He also analyzed pricing behavior in the metals industry for the Council on Wage and Price Stability in Washington, D.C. In 1999, Mr. Moeller received the award for most accurate forecast from the Forecasters' Club of New York. From 1990 to 1992 he was President of the New York Association for Business Economists. Mr. Moeller earned an M.B.A. in Finance from Fordham University, where he graduated in 1987. He holds a Bachelor of Arts in Economics from George Washington University.
More Economy in Brief