 Global| Jul 08 2008
U.S. Small Business Optimism Stable, Near 1975 Low
by:Tom Moeller
|in:Economy in Brief
Summary
Small business optimism, according to the National Federation of Independent Business (NFIB), was about unchanged in June but, at 88.2, the index remained near the lowest level since January 1975, its second lowest level on record. [...]
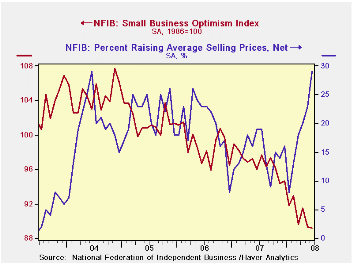
Small business optimism, according to the National Federation of Independent Business (NFIB), was about unchanged in June but, at 88.2, the index remained near the lowest level since January 1975, its second lowest level on record.
During the last ten years there has been a 70% correlation between the level of the NFIB index and the two quarter change in real GDP.
Improvement in the percentage of respondents with one or more
job openings was offset by deterioration in the percent expecting the
economy to improve. Twenty-one percent had one or more job openings.
During the last ten years there has been a 71% correlation between the
NFIB employment percentage and the y/y change in nonfarm payrolls. The
percentage planning to raise employment reversed its May deterioration
but remained near the least since early-2003. 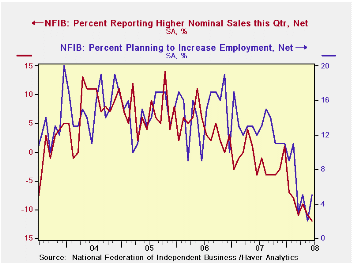
Seven percent of firms indicated that credit was harder to get, near the highest level since 1993 and that was about double the percentage during 2004.
Four percent of respondents thought that now was a good time to expand the business, the least since 1982, but 33% of respondents expected lower earnings, a record low.
The percentage of firms actually raising prices surged to 29%, the highest level since 1981. During the last ten years there has been a 64% correlation between the y/y change in the producer price index and the level of the NFIB price index. The percentage of firms planning to raise prices also surged to 36%, also its highest since 1981.
Twenty percent of respondents indicated that inflation was the single most important problem, the highest since 1981 and four times the percentage of the prior four years.
About 24 million businesses exist in the United States. Small business creates 80% of all new jobs in America.
The NFIB figures can be found in Haver's SURVEYS database.
| Nat'l Federation of Independent Business | June | May | Y/Y | 2007 | 2006 | 2005 |
|---|---|---|---|---|---|---|
| Small Business Optimism Index (1986=100) | 89.2 | 89.3 | -7.1% | 96.7 | 98.9 | 101.6 |
by Tom Moeller July 8, 2008
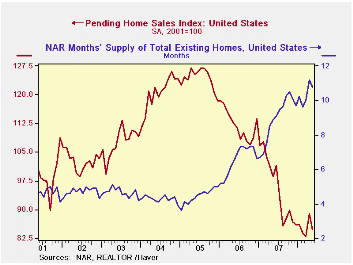
The National Association of Realtors reported that the level of pending sales of existing homes in May fell by 4.7% and reversed most of the 7.1% April gain. That was upwardly revised. The decline exceeded Consensus expectations for a 2.5% drop.
These figures are analogous to the new home sales data from
the Commerce Department in that they measure existing home sales when
the sales contract is signed, not at the time the sale is closed. The
series dates back to 2001.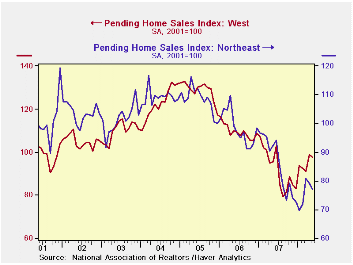
The regional figures indicate that sales out West fell a modest 1.3% after the 8.3% surge during April. Elsewhere in the country, sales continued weak. Sales in the Northeast fell 2.9% after a 1.9% fall in April. Sales in the Midwest retraced about half of the April gain with a 6.0% decline. Sales in the South reversed all of their upwardly revised April rise with a 7.1% decline.
The Realtors association indicated in an earlier report that the number of homes on the market & available for sale slipped a not seasonally adjusted 1.4% (+2.4% y/y) after a 10.5% jump during April.
At the current sales rate there was a 10.8 months' supply of homes on the market versus an 8.9 months' average during all of last year, a 6.5 months' supply in 2006 and a 4.5 months' supply in 2005.
The pending home sales data are available in Haver's PREALTOR database and the number of homes on the market are in the REALTOR database.
| Pending Home Sales (2001=100) | May | April | Y/Y | 2007 | 2006 | 2005 |
|---|---|---|---|---|---|---|
| Total | 84.7 | 88.9 | -14.0% | 95.7 | 112.1 | 124.3 |
| Northeast | 77.0 | 79.3 | -16.5 | 85.6 | 98.5 | 108.3 |
| Midwest | 78.6 | 83.6 | -13.8 | 89.6 | 102.0 | 116.4 |
| South | 84.5 | 91.0 | -22.1 | 107.3 | 127.3 | 134.8 |
| West | 97.5 | 98.8 | 2.0 | 92.1 | 109.5 | 128.6 |
by Tom Moeller July 8, 2008
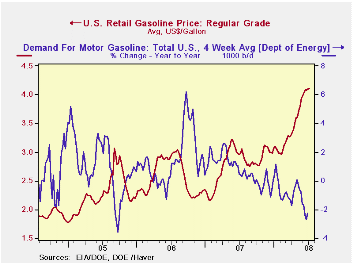
The retail price for a gallon of regular gasoline ticked up one penny last week to $4.11 per gallon, according to the U.S. Department of Energy survey. For all grades of gasoline the average price also rose two cents to an average $4.17 per gallon.
Yesterday, the spot market price for a gallon of regular gasoline slipped nine cents to $3.30 per gallon, about where it has been since early June.
Weekly gasoline prices can be found in Haver's WEEKLY
database, daily prices are in the DAILY
database.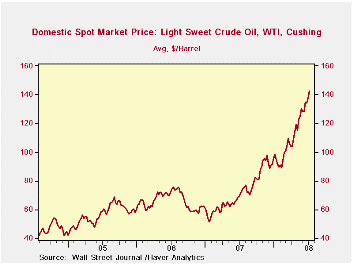
According to the U.S. Department of Energy the demand for gasoline during the latest four weeks fell 2.3% from a year earlier due to the increase in gasoline prices, along with the slowdown in economic growth.
The DOE figures are available in Haver's OILWKLY database.
The price for a barrel of West Texas Intermediate crude oil surged last week to $142.46 per barrel versus an average of $137.25 during the prior. Yesterday's price fell slightly from that level to $141.38.
Price for natural gas surged again last week to $13.185 per mmbtu, double a year earlier, and near the record high reached in late-2005.
Financial Regulation and Financial Stability is this morning's speech by Federal Reserve Chairman Ben S. Bernanke and it can be found here.
| Weekly Prices | 07/07/08 | 06/30/08 | Y/Y | 2007 | 2006 | 2005 |
|---|---|---|---|---|---|---|
| Retail Regular Gasoline ($ per Gallon) | 4.11 | 4.10 | 38.0% | 2.80 | 2.57 | 2.27 |
| Light Sweet Crude Oil, WTI ($ per bbl.) | 142.46 | 137.25 | 98.4% | 72.25 | 66.12 | 56.60 |
by Tom Moeller July 8, 2008
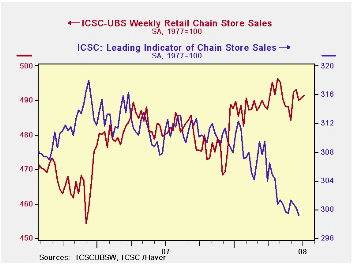
The International Council of Shopping Centers reported that chain store sales nudged up another 0.2% last week after the 0.1% uptick during the prior period. The level of sales early this month was even with the June average after sales rose 0.5% during that month.
During the last ten years there has been a 45% correlation between the y/y change in chain store sales and the change in nonauto retail sales less gasoline.The ICSC-UBS retail chain-store sales index is constructed using the same-store sales (stores open for one year) reported by 78 stores of seven retailers: Dayton Hudson, Federated, Kmart, May, J.C. Penney, Sears and Wal-Mart.
During the latest week, the leading indicator of chain store sales from ICSC-UBS fell 0.4% (-2.8% y/y).
The chain store sales figures are available in Haver's SURVEYW database.
Retirement Savings and Decision Errors: Lessons from Behavioral Economics from the Federal Reserve Bank of San Francisco is available here .
| ICSC-UBS (SA, 1977=100) | 07/06/08 | 06/28/08 | Y/Y | 2007 | 2006 | 2005 |
|---|---|---|---|---|---|---|
| Total Weekly Chain Store Sales | 491.5 | 490.7 | 2.3% | 2.8% | 3.3% | 3.6% |
by Louise Curley July 8, 2008
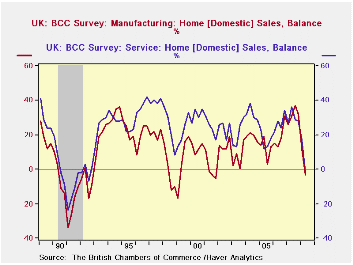
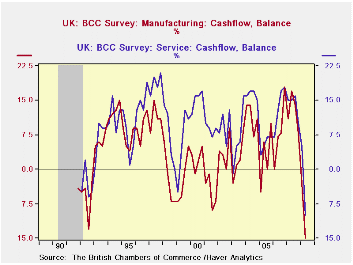
The second quarter British Chambers of Commerce (BBC) Quarterly Economic Survey presents a grim picture. Appraisals of domestic sales and orders and cash flow by both manufacturers and service providers show that pessimists now outweigh optimists. As shown in the first chart the percent balance for domestic sales by manufacturers fell to -5% from 8% in the first quarter while that of service providers fell, even more, to -7% from 14% in the first quarter. These balances are still above the balances reached in the last recession
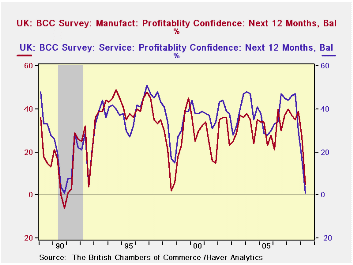
The changes in the appraisal of cash flow in manufacturing and the services are even more dramatic than those in sales as shown in the second chart. Data in this series do not extend back through the recession of the early nineties, but the current balances are the lowest ever recorded. Fewer businessmen are planning to expand plant and equipment and to hire additional employees. The percent balance of confidence in profitability over the next twelve months is now close to levels seen in the last recession as shown in the third chart.
The one bright spot in the survey is the manufacturer's appraisal of export sales and orders. The excess of optimists over pessimists regarding export sales increased 12 percentage points to 28% in the second quarter from 16% in the first quarter. The excess of optimists over pessimists regarding export orders increased 6 percentage points to 22% from 16% in the first quarter.
On balance, however, the survey results are hardly reassuring. David Kern, Economic Adviser to the BBC commented: "The Q2 results signal a menacing deterioration in UK prospects. We are now facing serious risks of recession."
| BRITISH CHAMBERS OF COMMERCE ECONOMIC SURVEY | Q2 08 | Q1 08 | Q2 07 | Q/Q CHG | Y/Y CHG | 2007 | 2006 | 2005 |
|---|---|---|---|---|---|---|---|---|
| Domestic Sales | ||||||||
| Manufacturing | -3 | 12 | 31 | -15 | -34 | 32 | 19 | 12 |
| Services | -2 | 17 | 36 | -19 | -38 | 30 | 27 | 17 |
| Export Sales | ||||||||
| Manufacturing | 28 | 16 | 30 | 12 | -2 | 26 | 24 | 17 |
| Services | 9 | 17 | 20 | -8 | -11 | 21 | 26 | 10 |
| Cash Flow | ||||||||
| Manufacturing | -15 | -3 | 17 | -18 | -32 | 13 | 8 | 3 |
| Services | -10 | 5 | 15 | -15 | -25 | 14 | 14 | 6 |
| Profitability Confidence (Next 12 Mo.) | ||||||||
| Manufacturing | 5 | 27 | 37 | -22 | -32 | 38 | 32 | 30 |
| Services | 1 | 17 | 46 | -16 | -45 | 42 | 40 | 31 |
by Robert Brusca July 8, 2008
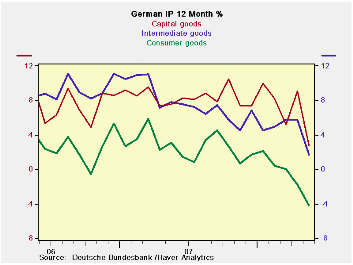
The weakness in German industrial output is spreading and
cumulating. Consumer goods output is off by 4% Yr/Yr a strong drop for
an inflation adjusted series. Capital goods and intermediates goods
output are still up Yr/Yr but are slowing sharply. Over three months
each of these major sectors is undergoing a compounded negative growth
rate that is in double digits. Consumer goods and capital goods output
are lower over six months as well.
In the table see also reading on MFG output and orders. These
series also show double digit loses over three months (annualized).
Moreover in the quarter to date (April & May) taken
over the Q1 average, all major sector growth rates are negative. MFG is
down at an 8.3% pace and MFG orders are off at a leading 12.3% pace.
The German Zew and IFO indices have been showing weakness. The
EU Commission indices for Germany are weak as well and the EMU-wide
indices show gathering downward momentum for the Zone. The Markit (NTC)
indices are sharply lower for MFG and Services.
While a lot of Europeans are saying ‘no’ to recession it looks
as though circumstances are changing. And that should be no surprise
given the wimpy puny actions of the ECB as inflation has run rampant
over its target. EMU-wide headline inflation is over 4% and the ECB
ceiling for it is 2%. I’d be more forgiving in my assessments if the
ECB gave us some new policy direction. I am, for example not very
critical of the Fed with the nearly the same inflation metrics in the
US. The Fed ‘targets’ core inflation and this is actually still
behaving and is within its ‘comfort zone’ on some measures. But the ECB
is a stubborn headline inflation targeter and it is way behind the
curve yet it is hiking rates by only 25 bp and saying a series of rate
hikes does not lie head? How does one makes any senses of that?
Especially as Euro-finance ministers were screaming at the ECB for even
that rate hike and today they are saying that they never pressured the
ECB at all. No, this is not a script for a US day-time soap opera
entitled ‘As The World Churns’…
What can all this mean?
It either means that the ECB has lost its mind, or that the
ECB is convinced that the strong euro is helping to slow the economy
sharply, making a policy to crush inflation now unnecessary and unwise.
Yet the 25bp hike was needed to bolster its own credibility with
inflation so far out of line. But of course not even the one-mandate
ECB can say that. With Germany weakening given its standing the
strongest economy in EMU the ECB must find the news of weaker German
industrial output as ‘welcome.’ The strong euro is doing its job so
that the ECB does not have to do so much itself directly. That means
that the ECB may be able to forego any more rate hikes as the weak EMU
economy will now do the heavy lifting to abate inflation pressures.
| Total German IP | |||||||
|---|---|---|---|---|---|---|---|
| Saar except m/m | May-08 | Apr-08 | Mar-08 | 3-mo | 6-mo | 12-mo | Quarter to-Date |
| IP total | -2.4% | -0.2% | -1.0% | -13.5% | -1.7% | 0.8% | -8.8% |
| Consumer | -1.4% | -2.9% | 0.8% | -13.2% | -5.7% | -4.2% | -14.7% |
| Capital | -3.9% | 2.7% | -2.2% | -13.1% | -3.0% | 2.7% | -4.9% |
| Intermed | -1.8% | -1.9% | 1.0% | -10.2% | 1.0% | 1.7% | -7.9% |
| Memo | |||||||
| Construction | 1.1% | -3.5% | -13.1% | -48.2% | -0.7% | -1.6% | -42.4% |
| MFG IP | -2.6% | -0.3% | -0.3% | -12.2% | -1.9% | 0.9% | -8.3% |
| MFG Orders | -0.9% | -1.7% | -0.5% | -11.9% | -10.7% | 0.2% | -12.3% |

Tom Moeller
AuthorMore in Author Profile »Prior to joining Haver Analytics in 2000, Mr. Moeller worked as the Economist at Chancellor Capital Management from 1985 to 1999. There, he developed comprehensive economic forecasts and interpreted economic data for equity and fixed income portfolio managers. Also at Chancellor, Mr. Moeller worked as an equity analyst and was responsible for researching and rating companies in the economically sensitive automobile and housing industries for investment in Chancellor’s equity portfolio. Prior to joining Chancellor, Mr. Moeller was an Economist at Citibank from 1979 to 1984. He also analyzed pricing behavior in the metals industry for the Council on Wage and Price Stability in Washington, D.C. In 1999, Mr. Moeller received the award for most accurate forecast from the Forecasters' Club of New York. From 1990 to 1992 he was President of the New York Association for Business Economists. Mr. Moeller earned an M.B.A. in Finance from Fordham University, where he graduated in 1987. He holds a Bachelor of Arts in Economics from George Washington University.
More Economy in Brief


