 Global| Jun 01 2009
U.S. Savings Rate Still Rising AsConsumers Remain Cautious
by:Tom Moeller
|in:Economy in Brief
Summary
The personal savings rate jumped last month to the highest level since early-1995. That rise may help explain earlier reports that confidence and sentiment are improving. Consumers are rebuilding their personal balance sheets, mending [...]
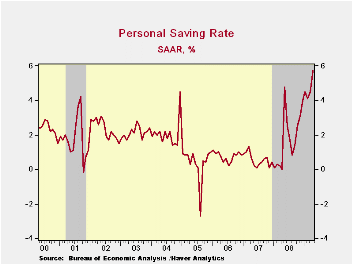
The personal savings rate jumped last month to the highest level since early-1995. That rise may help explain earlier reports that confidence and sentiment are improving. Consumers are rebuilding their personal balance sheets, mending their old ways of easy spending. That is the message from the latest Commerce Department report showing that the personal savings rate jumped during April to 5.7% which was its highest level in over thirteen years.
Spending restraint was evidenced in a slight 0.1% decline in personal expenditures during April. It followed a revised 0.3% March decline which was slightly deeper than initially reported. Adjusted for inflation, April spending also fell a slight 0.1% producing a level of real spending that has been unchanged since January.
As might be expected, spending on the largest durable good, motor vehicles, took a large hit and fell 1.3% (-16.9% y/y). Real spending on furniture & appliances also was cut back a slight 0.4% last month (-4.4% y/y) after the sharp 2.8% March drop. Real spending on apparel slipped just 0.1% (-6.5% y/y) after a 1.7% decline. The weakness extends to spending on services which rose all of 0.2% (1.1% y/y).
The sense of consumers' caution stems from weaker income
which remains under extreme pressure from the soft job market. Despite
a 0.5% rise during April, personal income has been flat this year
though the latest rise beat expectations for a 0.2% decline. Wages and
salaries reflected higher unemployment and were unchanged (-0.8% y/y)
following seven consecutive months of decline. In addition, the recent
decline in interest rates took its toll on interest income which in
April was off 5.5% y/y.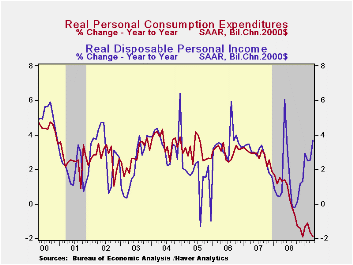
In light of weak income growth, what additional factor has kicked up the savings rate other than spending restraint? Lower taxes. They are off by nearly one-quarter during the last twelve months. Disposable personal income jumped 1.1% during April and over the last year has risen 4.1%, well in excess of the gain in total personal income. Adjusted for inflation, real disposable income also rose 1.1% last month and over the last year is up 3.7%. So far this year, real disposable income is up at a 6.3% annual rate.
Finally, the PCE chain price index benefited from a 2.6% seasonally adjusted decline in gasoline prices (-37.4% y/y) and rose just 0.1%. A bit firmer were core prices which posted a 0.3% April rise to lift the YTD rate of increase to 2.5% (AR). The latest gain in the overall price deflator exceeded Consensus expectations for a 0.2% rise.
The personal income & consumption figures are available in Haver's USECON and USNA databases.
| Disposition of Personal Income (%) | April | March | Y/Y | 2008 | 2007 | 2006 |
|---|---|---|---|---|---|---|
| Personal Income | 0.5 | -0.2 | 0.7 | 3.8 | 6.1 | 7.1 |
| Disposable Personal Income | 1.1 | 0.1 | 3.7 | 4.6 | 5.5 | 6.4 |
| Personal Consumption Expenditures | -0.1 | -0.3 | -1.5 | 3.6 | 5.5 | 5.9 |
| Saving Rate | 5.7 | 4.5 | 0.0 (April '08) | 1.8 | 0.5 | 0.7 |
| PCE Chain Price Index | 0.1 | 0.0 | 0.4 | 3.3 | 2.6 | 2.8 |
| Less food & energy | 0.3 | 0.2 | 1.9 | 2.2 | 2.2 | 2.3 |
by Robert Brusca June 1, 2009
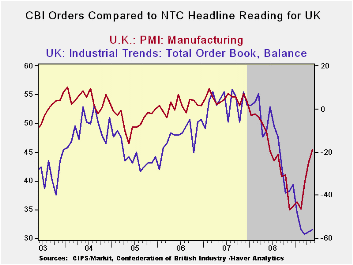 The UK MFG
PMI is up to a level of 45.37, the second highest reading in this group
of EU/EMU reporters (Greece is the highest). The UK index also is 10%
from its cycle high and 10% above its cycle low. The EMU measure is 17%
from its high and 7% up from its low.
The UK MFG
PMI is up to a level of 45.37, the second highest reading in this group
of EU/EMU reporters (Greece is the highest). The UK index also is 10%
from its cycle high and 10% above its cycle low. The EMU measure is 17%
from its high and 7% up from its low.
The UK MFG measure is up an EU best gain of 10.4 points
over the past three months. France Germany and Spain have the next best
increases up by 8.5, 7.98 and 7.44 points respectively. 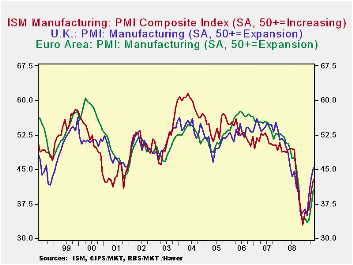 Europe is
improving, but the UK seems to be making the strongest MFG rebound so
far.
Europe is
improving, but the UK seems to be making the strongest MFG rebound so
far.
With the release of the US MFG PMI on Monday, the US index shows that it continues to hold its lead on Europe, signaling that the US recovery remains in the vanguard of the global expansion. It has about a four-month head start on EMU but its lead in terms of the level of the PMI index itself is small. The UK MFG rise has been ahead of the US sector for the past few months but that sector does not carry the global punch that the US does.
| Markit MFG Indexes | |||||||
|---|---|---|---|---|---|---|---|
| May-09 | Apr-09 | Mar-09 | 3Mo | 6Mo | 12Mo | Percentile | |
| Euro-Area | 40.68 | 36.83 | 33.93 | 37.15 | 35.55 | 39.92 | 29.5% |
| Germany | 39.58 | 35.40 | 32.36 | 35.78 | 34.02 | 40.26 | 27.7% |
| France | 43.32 | 40.10 | 36.51 | 39.98 | 37.93 | 40.87 | 38.0% |
| Italy | 41.11 | 37.21 | 34.59 | 37.64 | 36.58 | 39.82 | 28.5% |
| Spain | 39.83 | 34.61 | 32.92 | 35.79 | 33.20 | 35.31 | 39.5% |
| Austria | 39.30 | 38.97 | 33.68 | 37.32 | 35.78 | 40.53 | 24.0% |
| Greece | 46.08 | 40.88 | 38.17 | 41.71 | 40.83 | 45.34 | 46.3% |
| Ireland | 39.35 | 36.10 | 35.12 | 36.86 | 36.76 | 39.50 | 27.8% |
| EU | |||||||
| UK | 45.37 | 43.07 | 39.51 | 42.65 | 39.17 | 40.44 | 48.7% |
| percentile is over range since March 2000 | |||||||
by Louise Curley June 1, 2009
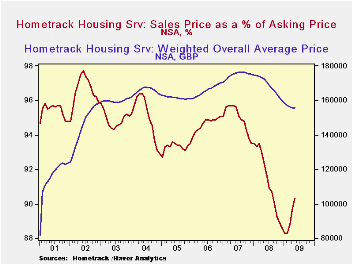
This May, the Hometrack Housing Survey, which processes
information gathered by real estate agents in England and Wales,
suggests that the decline in the property market may be reaching
bottom. Three of the indicators that Hometrack monitors continued to
improved in May and one was unchanged. The average price of a house was
unchanged from April, the first break in the steady monthly declines
that began in October 2007. The price is now 155,600 pounds, 16,600
pounds below a year ago and 29,700 pounds below the peak of 176,300
reached in June, July and August of 2007. The last time one could buy a
house near the current price was September 2002 when the average price
was 154,500 pounds.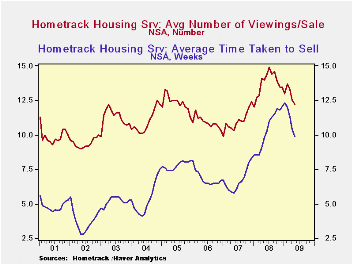
The difference between the selling price and the asking price has been narrowing since January and February of this year when the sale price was 88.3% the asking price. The May percentage was 90.3%, up from 89.6% in April. This percentage, however, is among the lower percentages recorded over the nine-year history of the data. The selling price was 97.7% of the selling price in January, 2002. The first chart shows the average price of a house and sales price and a percentage of the asking price since January 2001.
The average time it takes to sell a house has also been falling since January of this year when it took 12.3 weeks to complete a sale. In May it took 9.9 weeks. Again this is a relatively long time when viewed over the past nine years. From 2001 through 2007, the number of weeks it took to complete a sale varied from 2.8 in May and June of 2002 to 8.3 in December, 2007.
Finally, the number of viewings per sale has been slowly trending down since July 2008 when it reached 14.9. By May the number of viewings was 12.2, down from 12.5 in April. The second chart shows the average time taken to sell a house and the number of viewings per sale.
| UK Hometrack Housing Survey | May 09 | Apr 09 | May 08 | M/M Chg | Y/Y Chg | 2008 | 2007 | 2006 |
|---|---|---|---|---|---|---|---|---|
| House Price (000 GBP) | 155.6 | 155.6 | 172.2 | 0.0 | -16.6 | 168.7 | 174.4 | 165.7 |
| Sale Price/ Asking Price (%) | 90.3 | 89.6 | 92.3 | 0.7 | -2.0 | 91.3 | 96.0 | 94.7 |
| Average Time Taken to Sell (No. of Weeks) | 9.9 | 10.4 | 9.8 | -0.5 | 0.1 | 10.4 | 6.7 | 6.8 |
| Average Number of Viewings per Sale | 12.2 | 12.5 | 14.0 | -0.3 | -1.8 | 13.7 | 11.0 | 10.9 |
by Tom Moeller June 1, 2009
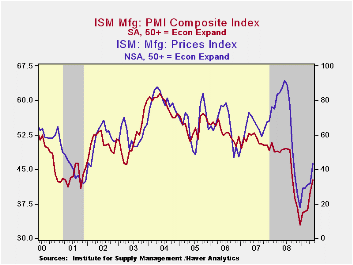
The manufacturing sector showed a further sign of modest improvement after its sharp decline in overall activity. The May composite index for the factory sector from the Institute for Supply Management rose to 42.8 from 40.1 in April. Though the latest figure still indicates a lower level of activity, as does any below the break-even point of 50, the rate of decline appears to be easing. The worst of the decline was at yearend '08 when the index reached 32.9. Consensus expectations were for a May reading of 42.3.
Improvement in the May components of the overall ISM index was limited, but encouraging. The new orders figure broached the break-even level of 50 for the first time since late 2007 with a rise to 51.1. The improvement came as only 19% (NSA) of survey participants reported lower orders ,versus a December high of 64%, while a still-low 27% reported higher orders. The export order index also improved to 48.0 versus the December reading of 35.5. During the last ten years there has been a 53% correlation between the index and the q/q change in real exports of goods in the GDP accounts.
The production component also improved to a level of 46.0,
which was its highest level since August and up off the low of 26.3 in
December. During the last ten years there has been an 84% correlation
between the level of the production component of the composite index
and the three-month growth in factory sector industrial production. It
is appropriate to correlate the ISM index level
with factory sector output growth because the ISM
index is a diffusion index. It measures growth by using all of the
positive changes in activity added to one half of the zero change in
activity measures. Another glimmer of improvement was that
the speed of supplier deliveries slowed for the second month.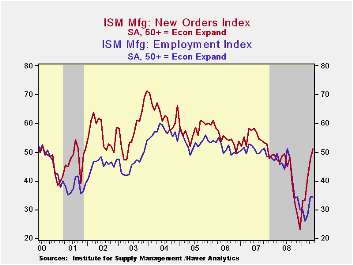
Elsewhere, improvement in the components was limited. The employment index was unchanged at a low reading of 34.3, though that was up from the February low. During the last ten years there has been an 89% correlation between the index level and the one-month change in manufacturing payrolls. Continued destocking played a role in that weakness as suggested by a low inventory index reading of 32.9 which was near the lowest level since 1982.
The separate index of prices paid rose sharply indicating that pricing power is rebuilding with improved activity levels. The reading of 43.5 was its highest since last September. During the last twenty years there has been a 79% correlation between the price index and the three-month change in the PPI for intermediate goods.
The ISM data is available in Haver's USECON database.
Positive Economic Signs Are Emerging; Recovery Will Take Time from the Federal Reserve Bank of St. Louis can be found here.
| ISM Mfg | May | April | May '08 | 2008 | 2007 | 2006 |
|---|---|---|---|---|---|---|
| Composite Index | 42.8 | 40.1 | 49.3 | 45.5 | 51.1 | 53.1 |
| New Orders Index | 51.1 | 47.2 | 48.6 | 42.1 | 54.3 | 55.4 |
| Employment Index | 34.3 | 34.4 | 46.2 | 43.2 | 50.5 | 51.7 |
| Prices Paid Index (NSA) | 43.5 | 32.0 | 87.0 | 66.5 | 64.6 | 65.0 |
by Tom Moeller June 1, 2009
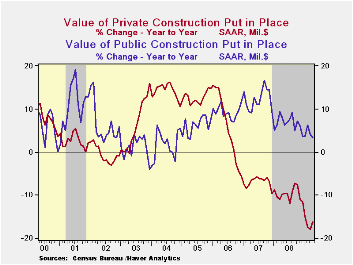
There's no real upward momentum driving the recent gains in construction spending, but it seems that an interim stabilization of earlier declines occurred this Spring. How long it will last is the question. For the second consecutive month the value of construction put-in-place unexpectedly rose; during April by 0.8% after a little-revised 0.4% March uptick. The gains followed declines ranging from 2% to 4% during each of the prior four months. Consensus expectations had been for a 1.6% April drop.
Another strong gain in the value of nonresidential building activity paced the April surprise. The 1.8% rise followed a 2.6% March increase. Nevertheless, the y/y gain decelerated to 2.0% following double-digit growth during each of the prior three years. Much of April's upside surprise was due to a 2.4% increase in the lodging category. Regardless, spending in this area has turned negative y/y following gains ranging between 30% and 60% during each of the prior three years. Elsewhere, office construction continued lower (-17.8% y/y) as did building in the commercial (-25.4% y/y), educational (-4.8% y/y) and amusement & recreation sectors (-18.0% y/y).
Residential building activity also bounced back by all of 0.7%
during April. Nevertheless, it was still off by one-third over the last
year and by two-thirds from the 2006 peak. Notably hard hit has been
single-family construction activity which ticked up 0.7% after falling
by three-quarters since 2006. Building activity on multi-family units
fell 2.6% during April (-17.4% y/y) but spending on improvements rose
8.9% (-13.8% y/y).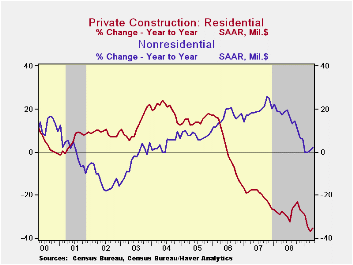
In contrast to the private sector gains, public construction dipped 0.6% during April; and the recession's effect on tax revenues lowered the year-to-year growth to 3.3% from its 2007 peak of 18.6%. The value of spending on transportation facilities fell 4.6% year-to-year while spending on highways & streets inched up just 0.2% y/y. The value of construction on highways & streets is roughly one-third of the value of total public construction spending.
During the last twenty years there has been an 84% correlation between the q/q change in the value of residential building and its contribution to growth in real GDP.
The more detailed categories of construction represent the Census Bureau’s reclassification of construction activity into end-use groups. Finer detail is available for many of the categories; for instance, commercial construction is shown for automotive sales and parking facilities, drugstores, building supply stores, and both commercial warehouses and mini-storage facilities. Note that start dates vary for some seasonally adjusted line items in 2000 and 2002, and that constant-dollar data are no longer computed.
The construction put-in-place figures are available in Haver's USECON database.
Making affordable housing greener from the Federal Reserve Bank of Boston can be found here.
| Construction (%) | April | March | Y/Y | 2008 | 2007 | 2006 |
|---|---|---|---|---|---|---|
| Total | 0.8 | 0.4 | -10.7 | -5.7 | -2.7 | 6.3 |
| Private | 1.4 | 0.2 | -16.1 | -9.8 | -6.9 | 5.5 |
| Residential | 0.7 | -3.6 | -35.0 | -27.7 | -19.8 | 1.0 |
| Nonresidential | 1.8 | 2.6 | 2.0 | 14.9 | 19.6 | 16.2 |
| Public | -0.6 | 1.0 | 3.3 | 6.7 | 12.3 | 9.3 |

Tom Moeller
AuthorMore in Author Profile »Prior to joining Haver Analytics in 2000, Mr. Moeller worked as the Economist at Chancellor Capital Management from 1985 to 1999. There, he developed comprehensive economic forecasts and interpreted economic data for equity and fixed income portfolio managers. Also at Chancellor, Mr. Moeller worked as an equity analyst and was responsible for researching and rating companies in the economically sensitive automobile and housing industries for investment in Chancellor’s equity portfolio. Prior to joining Chancellor, Mr. Moeller was an Economist at Citibank from 1979 to 1984. He also analyzed pricing behavior in the metals industry for the Council on Wage and Price Stability in Washington, D.C. In 1999, Mr. Moeller received the award for most accurate forecast from the Forecasters' Club of New York. From 1990 to 1992 he was President of the New York Association for Business Economists. Mr. Moeller earned an M.B.A. in Finance from Fordham University, where he graduated in 1987. He holds a Bachelor of Arts in Economics from George Washington University.
More Economy in Brief


