 Global| Jun 05 2008
U.S. - Rise in Initial Unemployment Insurance Claims Leveled Out
by:Tom Moeller
|in:Economy in Brief
Summary
Initial claims for unemployment insurance fell slightly last week to 357,000 from an upwardly revised 375,000 during the prior week. Consensus expectations had been for claims to remain unchanged. The four week moving average of [...]
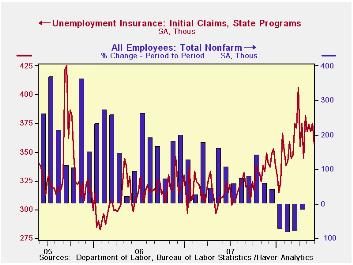
Initial claims for unemployment insurance fell slightly last week to 357,000 from an upwardly revised 375,000 during the prior week. Consensus expectations had been for claims to remain unchanged.
The four week moving average of initial claims fell slightly week-to-week to 368,500 (19.4% y/y) and the recent average is up just slightly from April when claims averaged 364,000. These numbers are down from March when initial claims averaged 375,000.
A claims level below 400,000 typically has been associated
with growth in nonfarm payrolls. During the last ten years there has
been a (negative) 76% correlation between the level of initial claims
and the m/m change in nonfarm payroll employment.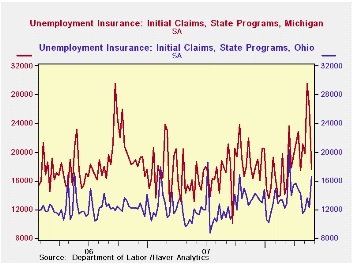
In selected states, initial claims in California have been roughly stable (16.3% y/y) since last Fall. In New York claims also have been stable recently (11.7% y/y) and they have trended slightly lower in Ohio (21.1% y/y). In Pennsylvania initial claims recently have trended slightly higher (25.9% y/y) although in Florida the trend also is up (40.8% y/y). The trend in claims has been up sharply in Michigan (62.0% y/y). These figures are available in Haver's REGIONW database.
Continuing claims for unemployment insurance fell 16,000 after an upwardly revised 41,000 increase during the prior week. The latest level was near the highest since March 2004. The four week average of continuing claims rose to 3,085,750 and the number provides some indication of workers' ability to find employment.
The continuing claims numbers lag the initial claims figures by one week.
The insured rate of unemployment held steady at 2.3% for the sixth week. That was the highest since 2004.
Yesterday's speech by Fed ChairmanBen S. Bernanke at Harvard University, Cambridge, MA is available here.
| Unemployment Insurance (000s) | 05/31/08 | 05/24/08 | Y/Y | 2007 | 2006 | 2005 |
|---|---|---|---|---|---|---|
| Initial Claims | 357 | 375 | 14.8% | 322 | 313 | 331 |
| Continuing Claims | -- | 3,093 | 22.4% | 2,552 | 2,459 | 2,662 |
by Tom Moeller June 5, 2008
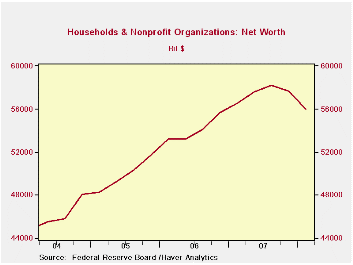
The net worth of the U.S. household sector deteriorated during 1Q to $55.97 trillion, down from the 3Q '07 record level of $58.196B. Net worth last quarter also fell 1.0% from a year earlier value of $56.532B
Household sector assets fell $1.6 trillion (-2.2%, +0.4% y/y) due to a $255.8 billion decline (-1.0%, +0.4% y/y) in tangible asset values. Real estate asset values fell 1.4% (-0.4% y/y). Financial asset values fell a harder 2.9% (+0.5% y/y) with the lower stock market. Total liabilities grew 0.7% (6.4% y/y).
Credit market debt outstanding owed by all sectors of the
economy grew 8.5% AR (9.0 % y/y) during the first quarter of 2008 as
the government's larger budget deficit boosted government debt
obligations by 5.7% y/y. Still, the y/y rise was about half the peak
10.9% rise during 2003.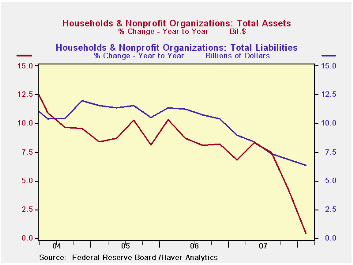
Household sector credit debt growth slowed to a 3.0% quarterly rate (6.4% y/y) with the slower economy. That was half the growth during 2004. As home purchases dropped, households' obligations on mortgages grew just 2.7% (5.5% y/y) and that was the lowest quarterly gain since early 1993. Consumer credit dropped at a 2.1% rate (+6.0% y/y) while bank loans surged to another high.
Credit market debt owed by the nonfinancial corporate business sector grew at a quarterly rate of 8.3% (10.8% y/y) which was near the strongest gain in ten years. The non-corporate business sector's debt owed also sped up (13.2% y/y).
Credit market debt growth owed by the financial sector decelerated to a 4.6% rate (10.2% y/y).
Banking Globalization, Monetary Transmission, and the Lending Channel is a paper recently presented by authors from the Federal Reserve Bank of New York. It is available here.
| Flow of Funds (Y/Y % Chg.) | % of Total | 1Q '08 | 4Q'07 | 2007 | 2006 | 2005 |
|---|---|---|---|---|---|---|
| Total Credit Market Debt Outstanding | -- | 8.5 | 9.0 | 9.0 | 9.4 | 8.9 |
| Federal Government | 11% | 5.7 | 4.9 | 4.9 | 3.9 | 7.0 |
| Households | 28% | 5.9 | 6.8 | 6.8 | 10.2 | 11.1 |
| Nonfinancial Corporate Business | 13% | 10.8 | 11.1 | 11.1 | 8.2 | 4.8 |
| Nonfarm, NonCorporate Business | 7% | 13.2 | 13.4 | 13.4 | 12.6 | 13.6 |
| Financial Sectors | 32% | 10.2 | 11.2 | 11.2 | 10.0 | 8.5 |
| Net Worth: Households & Nonprofit Organizations (Trillions) | -- | $55.970 | $57.666 | $57.666 | $55.677 | $51.716 |
| Tangible Assets: Households | -- | $26.395 | $26.650 | $26.650 | $25.964 | $24.385 |
| Financial Assets: Households | -- | $44.071 | $45.405 | $45.405 | $43.175 | $39.528 |
by Tom Moeller June 5, 2008
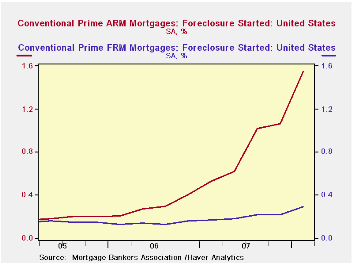
The Mortgage Bankers' Association reported that during the 1st quarter of this year, foreclosures were started on .99% of all mortgages outstanding. That latest level was again by far the highest foreclosure rate on record. Foreclosure rates on both prime and subprime mortgages rose sharply.
Foreclosures on all prime mortgage loans rose to 0.54% of loans outstanding from 0.41% during 4Q '07. The latest remained nearly double the rate during the prior nine years.
Rates for prime fixed rate mortgages rose slightly to 0.29% of loans outstanding from 0.22% during 4Q. There were 27.7 million of these loans on the books. Of the 6.4 million prime adjustable rate mortgages outstanding, the foreclosure rate rose to 1.55%, up from quarterly rates near 0.2% a few years ago.
As bad as the above data on prime debt was, the figures on
subprime mortgage debt continued far worse. In total, the rate of
foreclosure on subprime mortgages rose to 4.06% of outstanding loans
during 1Q '08. There were 5.5 million of these loans in the "pool."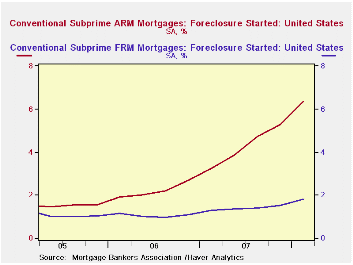
The foreclosure rate on subprime fixed rate debt rose to 1.80% of loans outstanding. That was up by more than half from the quarterly running rate in early 2006.There were 2.7 million of these loans outstanding. On variable rate subprime debt foreclosures also surged to 6.35% of loans outstanding from 5.29% during 4Q. There were 2.6 million of these loans on the books.
By the country's regions the Northeast saw an increase in the overall rate of foreclosure to 0.71% last quarter from 0.51% during 1Q '07. In the Midwest that rate rose to 0.98% from 0.79% a year earlier. The West saw an increase to 1.21% of loans outstanding from 0.49% in 1Q '07 and in the South foreclosures were started in 1Q on 0.96% of loans versus 0.54% one year earlier.
Today's testimony by Fed Vice ChairmanDonald L. Kohn, Condition of the Banking System, can be found here
These data series are available in Haver's MBAMTG database.
| Mortgages in Foreclosure (%) | 1Q '08 | 4Q '07 | 1Q '07 | 2007 | 2006 | 2005 |
|---|---|---|---|---|---|---|
| All Mortgages | 0.99 | 0.83 | 0.58 | 2.84 | 1.84 | 1.64 |
| Conventional Prime | 0.54 | 0.41 | 0.25 | 1.30 | 0.77 | 0.72 |
| Fixed Rate | 0.29 | 0.22 | 0.17 | 0.79 | 0.56 | 0.61 |
| ARM | 1.55 | 1.06 | 0.53 | 3.23 | 1.19 | 0.75 |
| Subprime | 4.06 | 3.44 | 2.43 | 11.71 | 7.23 | 5.66 |
| Fixed Rate | 1.80 | 1.52 | 1.30 | 5.55 | 4.24 | 4.33 |
| ARM | 6.35 | 5.29 | 3.23 | 17.08 | 8.80 | 6.07 |
by Robert Brusca June 5, 2008
As the dollar fell and euro rose German authorities gloated
about the resilience of their economy. German economic statistics have
largely remained firm and vibrant in the face of ever diminishing
competitiveness, as the euro rose. Well the bloom is off the rose (or
the rise) now. Orders are now giving that erstwhile optimism is
rightful comeuppance. German orders have now fallen month-to-month for
FIVE straight months lead by five straight months of foreign orders
dropping. During this span, domestic orders fell in three months, were
flat in one and rose in another - the most recent month of April posted
a small gain for domestic orders. German foreign order weakness is
concentrated within the Euro Area rather than in transactions that more
explicitly cross exchange rate lines. Still, within the Zone German
‘exporters’ continue to face competition from other producers domiciled
outside of the zone and producing with other currency-based production
costs… like the dollar.
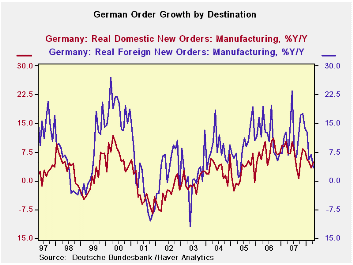
For the moment German own-country orders are holding up better
than foreign orders. Both sets of orders are still UP on the year (last
12-months), foreign orders by 3.4% and domestic orders by 4.8%, But
over three and six months foreign orders are dropping at an astonishing
-19% and -10% rate respectively. Meanwhile, over three and six months,
domestic orders’ annual rates of decline are the far more modest pace
of -1.7% and -0.9%. That’s so far. No country, especially within the
strong currency Euro-Area is an island, and Euro Area weakness abounds.
Still dogging Germany is the fact that domestic consumption
has not picked up. Orders for consumer goods lead the way lower.
Despite a sharp April bounced back in capital goods orders the series
remains mired in three-month and six-month negative growth trends with
weakness accelerating. Its fellow EMU members are fading fast, just as
growth is fading also in the UK.
The central banks in EMU and the UK are continuing to hold
firm to fight food and energy inflation. Meanwhile each looks set to
open up a larger GDP gap which will help to fight inflation along with
that strong euro, at least for EMU. Manufacturing sales are starting to
lose their zest in Germany. If the ECB was once worried about second
round effects if will now find its region populated by workers that are
going to be more concerned about jobs than about wages. Eventually that
development will breed different behavior on the part of the ECB but
that is still a long way off.
| German Orders and Sales By Sector and Origin | ||||||||
|---|---|---|---|---|---|---|---|---|
| Real and SA | % M/M | % Saar | ||||||
| Apr-08 | Mar-08 | Feb-08 | 3-Mo | 6-Mo | 12-Mo | Yr-Ago | QTR-2-Date | |
| Total Orders | -1.8% | -0.5% | -0.6% | -11.1% | -5.7% | 4.0% | 6.9% | -13.2% |
| Foreign | -3.8% | -0.3% | -1.1% | -19.2% | -10.1% | 3.4% | 6.8% | -23.4% |
| Domestic | 0.3% | -0.8% | 0.0% | -1.7% | -0.9% | 4.8% | 7.0% | -1.0% |
| Real Sector Sales | ||||||||
| MFG/Mining | -0.9% | -0.6% | -0.1% | -5.8% | -3.0% | 5.2% | 5.1% | -7.3% |
| Consumer | -1.8% | 0.2% | -1.8% | -12.9% | -6.7% | -0.9% | 2.0% | -13.0% |
| Cons Durables | 0.2% | -0.9% | -0.3% | -4.0% | -2.0% | 3.5% | -0.1% | -3.0% |
| Cons Non-Durable | -2.1% | 0.3% | -2.0% | -14.4% | -7.5% | -1.6% | 2.3% | -14.5% |
| Capital Goods | 2.4% | -2.6% | -0.8% | -3.9% | -2.0% | 9.5% | 4.5% | 2.3% |
| Intermediate Goods | -4.2% | 1.6% | 1.7% | -4.1% | -2.1% | 3.5% | 7.7% | -14.9% |
| All MFG-Sales | -0.8% | -0.6% | -0.2% | -6.2% | -3.2% | 4.8% | 4.8% | -7.3% |

Tom Moeller
AuthorMore in Author Profile »Prior to joining Haver Analytics in 2000, Mr. Moeller worked as the Economist at Chancellor Capital Management from 1985 to 1999. There, he developed comprehensive economic forecasts and interpreted economic data for equity and fixed income portfolio managers. Also at Chancellor, Mr. Moeller worked as an equity analyst and was responsible for researching and rating companies in the economically sensitive automobile and housing industries for investment in Chancellor’s equity portfolio. Prior to joining Chancellor, Mr. Moeller was an Economist at Citibank from 1979 to 1984. He also analyzed pricing behavior in the metals industry for the Council on Wage and Price Stability in Washington, D.C. In 1999, Mr. Moeller received the award for most accurate forecast from the Forecasters' Club of New York. From 1990 to 1992 he was President of the New York Association for Business Economists. Mr. Moeller earned an M.B.A. in Finance from Fordham University, where he graduated in 1987. He holds a Bachelor of Arts in Economics from George Washington University.
More Economy in Brief


