 Global| Jan 24 2012
U.S. Richmond Fed Index Improves
by:Tom Moeller
|in:Economy in Brief
Summary
The Federal Reserve Bank of Richmond reported that its Composite Index of Manufacturing Sector Activity improved during January to 12 from 3 in December. The latest was the highest level since March but compared unfavorably to the [...]
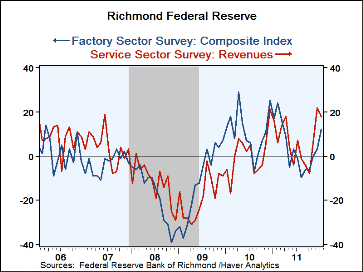
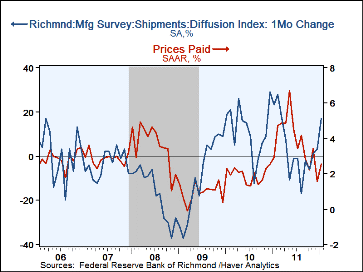
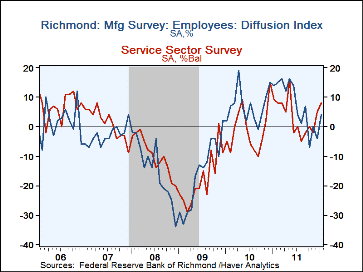
The Federal Reserve Bank of Richmond reported that its Composite Index of Manufacturing Sector Activity improved during January to 12 from 3 in December. The latest was the highest level since March but compared unfavorably to the levels of Q1'11 and Q4'10. The latest m/m gain was led by greatly improved shipments & new orders, as well as higher employment. The index of prices paid also rose moderately but remained down sharply from last year's May high.
Service sector activity did not show the same bounce as did manufacturing. The index of revenues slipped m/m to 18 but remained well up from the negative values of last year. The index for the number of employees, however, advanced to its highest since May. Within the service sector, the retail index of revenues made up a December decline and advanced to its highest level in twelve months. The number of employees index rose moderately but was still well off its 2011 highs. In the nonretail sector, the index fell m/m to 17 but remained well above the negative values of this past October. The employees index also slipped but was up sharply from the summer's negative values. Pricing power in services diminished m/m but still was near its strongest since 2006.
These seasonally-adjusted Richmond Fed figures cover activity in the Mid-Atlantic States of Maryland, North and South Carolina, Virginia and West Virginia. The data is available in Haver's SURVEYS database.
| Richmond Federal Reserve | Jan | Dec | Nov | Jan'11 | 2011 | 2010 | 2009 |
|---|---|---|---|---|---|---|---|
| Manufacturing-Sector Survey (Composite Index) | 12 | 3 | 0 | 17 | 4 | 11 | -11 |
| Shipments | 17 | 3 | 1 | 23 | 3 | 12 | -10 |
| Number of Employees | 4 | -4 | 0 | 14 | 7 | 7 | -16 |
| Prices Paid (Annualized by Respondents, %) | 2.53 | 1.55 | 3.42 | 2.94 | 3.85 | 1.95 | 0.95 |
| Service-Sector Survey (% Increasing Revenues) | 18 | 22 | 6 | 16 | 6 | 1 | -19 |
| Retail Subsector | 23 | 4 | 23 | 46 | -0 | -1 | -16 |
| Non-Retail | 17 | 24 | 11 | 9 | 8 | 2 | -20 |
Tom Moeller
AuthorMore in Author Profile »Prior to joining Haver Analytics in 2000, Mr. Moeller worked as the Economist at Chancellor Capital Management from 1985 to 1999. There, he developed comprehensive economic forecasts and interpreted economic data for equity and fixed income portfolio managers. Also at Chancellor, Mr. Moeller worked as an equity analyst and was responsible for researching and rating companies in the economically sensitive automobile and housing industries for investment in Chancellor’s equity portfolio. Prior to joining Chancellor, Mr. Moeller was an Economist at Citibank from 1979 to 1984. He also analyzed pricing behavior in the metals industry for the Council on Wage and Price Stability in Washington, D.C. In 1999, Mr. Moeller received the award for most accurate forecast from the Forecasters' Club of New York. From 1990 to 1992 he was President of the New York Association for Business Economists. Mr. Moeller earned an M.B.A. in Finance from Fordham University, where he graduated in 1987. He holds a Bachelor of Arts in Economics from George Washington University.
More Economy in Brief
 Global| Feb 05 2026
Charts of the Week: Balanced Policy, Resilient Data and AI Narratives
by:Andrew Cates


