 Global| Jun 11 2010
U.S. Retail Spending Disappoints Across-the-Board
by:Tom Moeller
|in:Economy in Brief
Summary
U.S. consumers took a break during May from their shopping spree after the recession's end. Retail sales declined 1.2% last month following an upwardly revised 0.6% April rise. The drop disappointed Consensus expectations for a 0.2% [...]
 U.S. consumers took a break
during May from their shopping spree after the recession's end. Retail
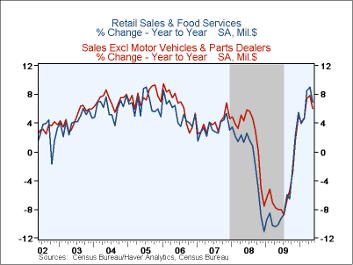
sales declined 1.2% last month following an upwardly revised 0.6% April
rise. The drop disappointed Consensus expectations for a 0.2% increase.
Nevertheless, sales have risen 5.7% since the recession's end last June.
Despite last month's already reported increase in unit sales, retail purchases of motor vehicles fell 1.7% during May. The y/y gain of 12.6%, however, is close to the gain in unit purchases. Finally, sales at gasoline service stations fell 3.3% (+20.2% y/y). It was further evidence that higher prices are discouraging gas usage since prices fell just 0.4% m/m.
Nonauto sales declined 1.1% after the 0.6% April increase which was revised up slightly. The decline also disappointed Consensus expectations for a 0.1% uptick. The shortfall was paced by a 9.3% drop (+3.1% y/y) in sales at building materials and hardware stores.
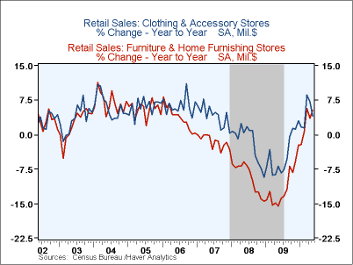
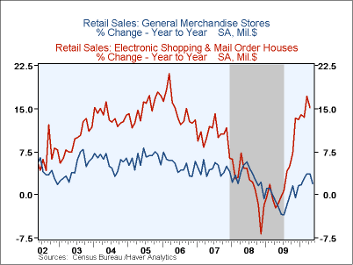
Also disappointing was "core" discretionary spending. Apparel store sales declined 1.3% (+4.1% y/y) after a 0.7% April decline. General merchandise store sales also fell by 1.1% following a 0.2% slip during April. Working the other way, sales of furniture, home furnishings & electronics rose 0.8% (5.2% y/y) and recovered most of the April decline. Furniture sales alone rose 1.0% (5.3% y/y) while a 0.6% increase (5.0% y/y) in sales of electronics & appliances recovered all of the April drop. Sales by internet & catalogue vendors ticked up 0.2% (15.2% y/y) but April sales were revised sharply higher and rose 2.5%. Food service sales ticked
The retail sales data are available in Haver's USECON database.
The latest Beige Book covering regional economic conditions from the Federal Reserve Board can be found here .
| May | April | March | May y/y | 2009 | 2008 | 2007 | |
|---|---|---|---|---|---|---|---|
| Total Retail Sales & Food Services (%) | -1.2 | 0.6 | 2.1 | 6.8 | -6.3 | -1.0 | 3.3 |
| Excluding Autos | -1.1 | 0.6 | 1.2 | 6.1 | -5.1 | 2.3 | 3.9 |
| Non-Auto Less Gasoline | -0.8 | 0.6 | 1.2 | 4.4 | -1.9 | 1.2 | 3.5 |
by Robert Brusca June 11, 2010
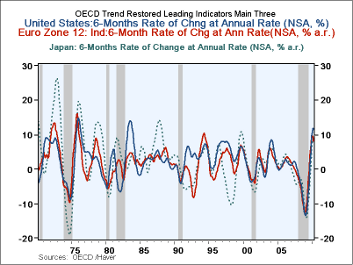 A slowing in growth: The overall OECD area leading indicator rose by
0.2% this month as the growth rate over three-months fell short of the
six month pace and the six month pace fell short of the 12-month pace.
Slowing is on schedule in some sense - The Yr/Yr growth rates are still at very elevated rates. But the pace is beginning to slow. Since we are looking at the highest growth rates for these three leading countries on this measure since the early 1970s it is not surprising that the pace is beginning to ratchet lower. Rarely have the three key OECD regions/countries grown at a pace in excess of what they are showing now.
Euro-Area is being stung by its debt problem fallout: The euro-area indicator, however, isn’t just slowing. Its indicator is actually dropping by 4.7% month-to-month. It is perhaps the first real sign that Europe’s growth is being ensnared by the geopolitical and debt problems of the region. Over three months the OECD measure for the euro-area is up by just 1% at an annual rate. This compares to a 4% pace for the entire OECD region and a 7% pace for the US.
The decelerations: Over six months the OECD growth rates have fallen to about 60% of their 12 month pace. For Japan and the US things are holding up better as Japan’s current growth over six-months is 82% of its twelve-month pace and for the US it is 75% of its twelve-month pace. But for the euro-area growth it is only 36% of its twelve-month pace over the last six-months. The OECD prefers to look at six month growth rates and if we compare the current six month pace (Apr 2010-Oct 2009) to the previous six-month pace (May2009 to Oct2009) the OECD deceleration is even more stark with growth in the recent six month period that is only 21% of growth in the previous six month period.
Prospects: On balance the revival of the OECD region, judging from the leading indicator growth, has been excellent. But the real proof is in the sort of recovery that develops, not the strength of the indicator that precedes it. The sharp recent fall-off of the euro-area index is a warning of another sort. The sorts of variables that plug into leading indicators can be accurate harbingers and they can also be the sorts of things that overreact to events. Right now the euroarea is trying to sort out the nature of the geopolitical and economic mess that it is in. There has been far more contagion that has affected expectations and other sensitive variables outside the zone that there will be transmission of weakness from the Zone to theses same regions. I also believe that the financial element of the crisis is overblown –a bit like reinjuring an old wound before it is fully healed. It will take time to see how much actual economic data are affected by these ongoing developments in the Zone and in Europe. I think the OECD indices overstate the prospects for weakness in Europe.
| OECD Trend-restored leading Indicators | ||||||
|---|---|---|---|---|---|---|
| Growth:M/M | Growth progression-SAAR | |||||
| Apr-10 | Mar-10 | 3Mos | 6Mos | 12mos | Yr-Ago | |
| OECD | 0.2% | 0.3% | 4.0% | 5.9% | 9.7% | -10.2% |
| OECD7 | -5.2% | 0.3% | 4.1% | 6.2% | 10.1% | -11.7% |
| OECD.Euro-Area | -4.7% | 0.1% | 1.0% | 3.0% | 8.2% | -9.9% |
| OECD.Japan | 0.2% | 0.4% | 4.5% | 7.5% | 9.1% | -13.9% |
| OECD US | 0.5% | 0.6% | 7.0% | 8.7% | 11.6% | -12.4% |
| Six months | Six month readings at 6-Mo Intervals: | |||||
| Change in 6m avg | Recent six | 6Mo Ago | 12Mo Ago | 18MO Ago | ||
| OECD | 4.6% | 5.2% | 5.9% | 13.6% | -6.5% | -13.7% |
| OECD7 | 4.8% | 5.5% | 6.2% | 14.2% | -8.7% | -14.6% |
| OECD.Eur | 3.7% | 4.5% | 3.0% | 13.6% | -4.1% | -15.2% |
| OECD.Japan | 5.0% | 5.3% | 7.5% | 10.7% | -14.6% | -13.1% |
| OECD US | 5.6% | 6.0% | 8.7% | 14.6% | -10.2% | -14.5% |
| Slowdowns indicated by BOLD RED | ||||||
by Robert Brusca June 11, 2010
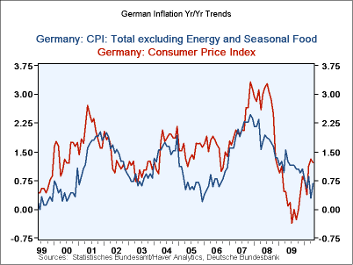
The German harmonized inflation rate rose by 01% in May, Germany's domestic headline inflation measure fell by 0.1% with the core up at a sharp +0.5% offsetting last month's 0.4% drop.
Headline inflation in Germany is steadily increasing with the annualized rate climbing over shortening time spans at 1.2% over 12-mos, 1.3%over 6-mos and 2.6% over 12-mos. Core inflation is still tempered at a 1.5% three-month pace in May. But it is not showing clear acceleration as the 1.5% standing is higher than both the Yr/Yr and the six-month pace but the six month pace shows deceleration from 12-months. On balance there are some core pressures but they are not as steady building as for headline inflation.
How widespread is inflation's acceleration? Using the main 11 categories in the table inflation is accelerating over three-months compared to six months in 63% of the categories. It' acceleration over six months compared to 12-months is only in only 36% of the categories. It is accelerating Yr/Yr compared to the pace of one year ago in 54% of the categories. On balance there is evidence of inflation and it is most acute over three-months where the measurement is the least reliable and most volatile. Apart from the 3-month diagnostic, inflation's acceleration does not seem that sharp or widespread.
One key for the ECB is going to be how to deal with oil that has been booming and busting and wreaking havoc with price trends and with inflation more generally. A second key will be to see how it deals with all the financial distress in the region. There is not only financial distress but national austerity plans in train. With all of these negative growth shocks we would expect the ECB to be a bit more inflation-tolerant than it might be in other times. But that is still a question for the policymakers. After all, stimulus is being breathed into the euro-economy by the ever weakening currency. And with that comes some added inflation threat to counter the downside growth risks. What will the ECB do? That is what we will be watching to see. I expect temperance but I am ever wary.
| German HICP and CPI details | |||||||
|---|---|---|---|---|---|---|---|
| Mo/Mo % | Saar % | Yr/Yr | |||||
| May-10 | Apr-10 | Mar-10 | 3-Mo | 6-Mo | 12-Mo | Yr Ago | |
| HICP Total | 0.1% | -0.2% | 0.6% | 1.9% | 1.1% | 1.2% | 0.0% |
| Core | #N/A | -0.5% | 0.4% | #N/A | #N/A | #N/A | 1.2% |
| CPI | |||||||
| All | -0.1% | 0.2% | 0.6% | 2.6% | 1.3% | 1.2% | 0.1% |
| CPIxF&E | 0.5% | -0.4% | 0.3% | 1.5% | 0.4% | 0.7% | 1.2% |
| Food | -0.4% | 0.6% | 1.1% | 5.2% | 3.9% | 1.1% | -1.2% |
| Alcohol | -0.1% | 0.1% | 0.3% | 1.1% | 1.2% | 3.1% | 1.2% |
| Clothing & Shoes | 0.3% | 0.2% | 0.4% | 3.5% | 3.8% | 1.2% | 1.8% |
| Rent &Util | 0.0% | 0.5% | 0.4% | 3.3% | 2.0% | 1.0% | 0.4% |
| Health Care | 0.1% | -0.2% | 0.1% | 0.0% | -0.2% | 0.2% | 1.4% |
| Transport | -0.7% | -0.2% | 1.1% | 0.7% | 0.7% | 4.1% | -3.9% |
| Communication | -0.1% | -0.1% | -0.2% | -1.8% | -2.7% | -1.8% | -2.5% |
| Rec &Culture | 1.8% | -2.7% | 1.0% | 0.0% | -0.4% | -0.3% | 2.0% |
| Education | -0.8% | -1.6% | -0.6% | -11.2% | -5.3% | -1.3% | -5.4% |
| Restaurant & Hotel | 0.4% | -1.0% | 1.3% | 2.6% | 1.3% | 1.1% | 2.6% |
| Other | 0.2% | 0.5% | 0.0% | 2.6% | -0.7% | 0.8% | 1.3% |
| Diffusion | 63.6% | 36.4% | 54.5% | -- | |||
| Type: | Diffusion: Current Compared to | 6-mo | 12-mo | Yr-Ago | -- | ||
by Tom Moeller June 11, 2010
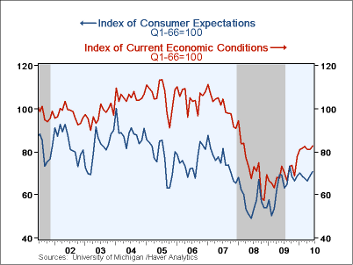
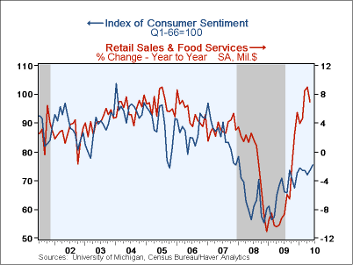 The University of Michigan
indicated that its mid-June measure of consumer sentiment added to
earlier gains and rose to 75.5, its highest level since January 2008.
Since its low late in 2008 the measure has risen by more than
one-third. During the last ten years there has been an 89% correlation
between the level of sentiment and the y/y change in real consumer
spending.
The index of expected economic conditions led last month's advance with a 2.8% increase to 70.7. The index was up 43.7% from the 2008 low. The readings for the expected change in personal finances (-3.3% y/y) and expected five-year business conditions (1.2% y/y) both improved. Expectations for business conditions during the next year slipped (+14.5% y/y).
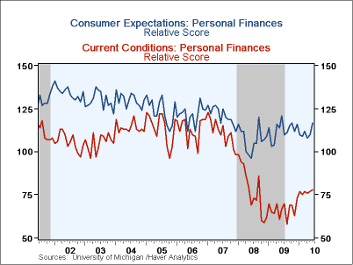
Sentiment about current economic conditions also improved to the highest level since early-2008 and it was up 44.2% from the 2008 low. The assessment of current personal finances continued its steady improvement and buying conditions for large household goods, including furniture, refrigerators, stoves & televisions, rose back to its highest level since early-2008 (12.4% y/y).
Expected price inflation during the next year fell sharply m/m to 3.1% but remained up from the December 2008 reading of 1.7%. Respondents' view of government policy, which may eventually influence economic expectations, rose m/m to its highest level since January but remained down sharply from its high last May. Sixteen percent of respondents thought that a good job was being done by government versus 36% who thought a poor job was being done.
The Reuters/University of Michigan survey data are not seasonally adjusted. The reading is based on telephone interviews with about 500 households at month-end. These results are based on about 320 interviews. The summary indexes are in Haver's USECON database with details in the proprietary UMSCA database.
The "Inflation" in Inflation Targeting from the Federal Reserve Bank of San Francisco is available here.
| University of Michigan | Mid-June | May | April | Juney/y | 2009 | 2008 | 2007 |
|---|---|---|---|---|---|---|---|
| Consumer Sentiment | 75.5 | 73.6 | 72.2 | 6.6% | 66.3 | 63.8 | 85.6 |
| Current Conditions | 82.9 | 81.0 | 81.0 | 13.3 | 69.6 | 73.7 | 101.2 |
| Expectations | 70.7 | 68.8 | 66.5 | 2.2 | 64.1 | 57.3 | 75.6 |
by Tom Moeller June 11, 2010
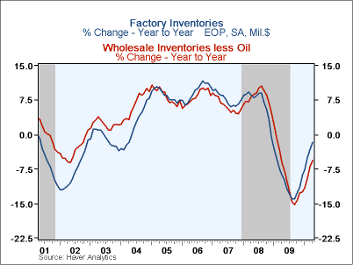
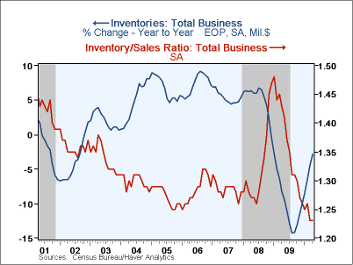 Business inventories indeed have started to
increase, but the rate of accumulation has been modest. April
inventories posted a 0.4% increase and it was the sixth gain in seven
months. The rise was enough to slow the y/y rate of decumulation to
2.8% from -14.3% last summer, but the value of inventories remained
down 12.5% from the 2008 peak. Moreover, the increases have not kept up
with the improvement in sales and the I/S ratio remained at its
historic low of 1.23.
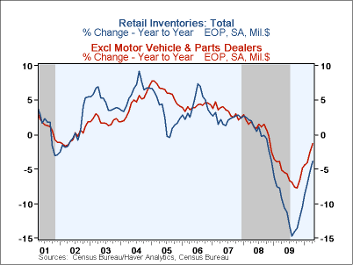
Retail inventories have started to rise and the 0.2% April uptick was the fifth modest increase following sharp declines during 2008 & 2009. Nevertheless, the level of inventories remained 13.6% below the 2008 peak. Accumulation this year owes to modest gains in the auto sector. Less autos, accumulation began only in March and it's been slight. Year-to-year inventories still are down 1.3% versus the peak decumulation rate of 7.7% last fall. The slowdown has been led by furniture & general merchandise stores while the decline in apparel store inventories has finally abated to -6.7% y/y.
Inventory accumulation in the factory sector compares with sharp decumulation through most of 2009. It has been accompanied by higher wholesale inventories, but here the improvement has been raised by higher oil prices. Less oil, wholesale inventories have been virtually flat for all of this year (-5.7% y/y).
The business sales and inventory data are available in Haver's USECON database.
| Business Inventories(%) | April | March | February | April y/y | 2009 | 2008 | 2007 |
|---|---|---|---|---|---|---|---|
| Total | 0.4 | 0.7 | 0.6 | -2.8 | -9.8 | 0.8 | 4.0 |
| Retail | 0.2 | 0.9 | 0.2 | -3.8 | -10.4 | -3.3 | 2.5 |
| Retail excl. Auto | 0.4 | 1.1 | -0.1 | -1.3 | -4.9 | -1.9 | 2.7 |
| Wholesale | 0.4 | 0.7 | 0.6 | -3.2 | -10.5 | 3.7 | 6.4 |
| Manufacturing | 0.5 | 0.5 | 1.0 | -1.6 | -8.7 | 2.2 | 3.7 |
Tom Moeller
AuthorMore in Author Profile »Prior to joining Haver Analytics in 2000, Mr. Moeller worked as the Economist at Chancellor Capital Management from 1985 to 1999. There, he developed comprehensive economic forecasts and interpreted economic data for equity and fixed income portfolio managers. Also at Chancellor, Mr. Moeller worked as an equity analyst and was responsible for researching and rating companies in the economically sensitive automobile and housing industries for investment in Chancellor’s equity portfolio. Prior to joining Chancellor, Mr. Moeller was an Economist at Citibank from 1979 to 1984. He also analyzed pricing behavior in the metals industry for the Council on Wage and Price Stability in Washington, D.C. In 1999, Mr. Moeller received the award for most accurate forecast from the Forecasters' Club of New York. From 1990 to 1992 he was President of the New York Association for Business Economists. Mr. Moeller earned an M.B.A. in Finance from Fordham University, where he graduated in 1987. He holds a Bachelor of Arts in Economics from George Washington University.
More Economy in Brief
 Global| Feb 05 2026
Charts of the Week: Balanced Policy, Resilient Data and AI Narratives
by:Andrew Cates


