 Global| Apr 13 2006
U.S. Retail Sales Rebound
by:Tom Moeller
|in:Economy in Brief
Summary
US retail sales rebounded 0.6% last month from a 0.8% decline during February that was revised from the 1.3% drop reported initially. Consensus expectations has been for a for a 0.5% gain. Motor vehicle & parts dealers sales rebounded [...]
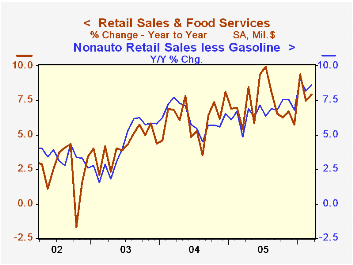
US retail sales rebounded 0.6% last month from a 0.8% decline during February that was revised from the 1.3% drop reported initially. Consensus expectations has been for a for a 0.5% gain.
Motor vehicle & parts dealers sales rebounded 1.6% (3.3% y/y) from a 2.8% February decline, initially reported at -4.6%. The rise compared to a slight 0.1% m/m decline in auto sales to 16.59M units.
Nonauto sales increased 0.4% after a 0.3% February decline that was slightly milder than the 0.4% fall in the advance report and was a bit short of Consensus expectations for a 0.5% increase.
Consumer spending on discretionary items was flat during March. General merchandise store sales rose 0.1% (6.4% y/y) after a 0.1% February slip. Apparel store sales registered a negligible decline (+6.6% y/y) after a 1.1% skid one month earlier while sales of furniture, electronics & appliances slipped 0.2% (+7.1% y/y) on the heels of a 2.9% flop during February.
Building material sales were an area of strength last month and posted a 1.2% (17.9% y/y) increase after a downwardly revised 0.4% February increase. The February increase contrasted with the 1.5% jump estimated initially.
Sales at gasoline stations slipped 0.1% (+13.6% y/y) though retail gasoline prices rose 6.3% m/m to $2.43 per gallon.
Nonauto retail sales less gasoline rose 0.4% (8.7% y/y) last month following a 0.1% slip during February.
Sales of nonstore retailers (internet & catalogue) increased 1.6% (14.1% y/y) after a little revised 3.1% jump during February.
Recent Developments in Consumer Credit and Payments from the Federal Reserve Bank of Philadelphia is available here.
| Mar | Feb | Y/Y | 2005 | 2004 | 2003 | |
|---|---|---|---|---|---|---|
| Retail Sales & Food Services | 0.6% | -0.8% | 7.9% | 7.2% | 6.2% | 4.2% |
| Excluding Autos | 0.4% | -0.3% | 9.2% | 8.2% | 7.2% | 4.7% |
by Tom Moeller April 13, 2006
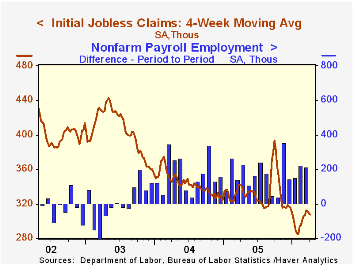
Initial claims for unemployment insurance jumped 12,000 to 313,000 last week and reversed all of the decline in claims during the prior two weeks. Consensus expectations had been for 302,000 claims and the prior week's decline was revised shallower.
During the last ten years there has been a (negative) 75% correlation between the level of initial jobless insurance claims and the m/m change in payroll employment.
The four-week moving average of initial claims slipped to 307,500 (-10.0% y/y).
Continuing claims for unemployment insurance fell 4,000 during the latest week following a revised 34,000 decline the prior week.
The insured rate of unemployment was stable at 1.9% for the eighth consecutive week.
Aggregate shocks and labor market fluctuations from the Federal Reserve Bank of St. Louis is available here.
| Unemployment Insurance (000s) | 04/08/06 | 04/01/06 | Y/Y | 2005 | 2004 | 2003 |
|---|---|---|---|---|---|---|
| Initial Claims | 313 | 301 | -6.3% | 332 | 343 | 402 |
| Continuing Claims | -- | 2,424 | -9.3% | 2,662 | 2,924 | 3,532 |
by Tom Moeller April 13, 2006
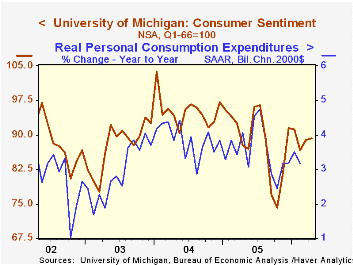
Consumer sentiment inched 0.3% higher early in April on the heels of the moderate 2.5% improvement during March. The University of Michigan's Sentiment Index rose to 89.2 and about matched Consensus expectations.
During the last ten years there has been a 76% correlation between the level of consumer sentiment and the y/y change in real consumer spending.
The current conditions index rose 1.8% after 3.3% during March. The index of personal finances added 1.7% (6.2% y/y) to the 5.4% improvement during March and the reading of buying conditions for large household goods rose 1.8% (6.3% y/y) following a similar increase the month prior. Consumers' assessment of gov't economic policy improved sharply (-1.1% y/y) and reversed the m/m declines of the prior two months.
Consumer expectations slipped for the third month this year due to a worsened short (-4.2% y/y) and long (-8.8% y/y) term outlook for business conditions. The expected change in personal finances improved for the third consecutive month (+3.3% y/y).
The mean expected inflation rate for the next twelve months was stable m/m at 3.8% and remained down from the 5.5% expected in October & September. For the next 5-10 years an inflation rate of 3.4% is expected.
The University of Michigan survey is not seasonally adjusted.The mid-month survey is based on telephone interviews with 250 households nationwide on personal finances and business and buying conditions. The survey is expanded to a total of 500 interviews at month end.
| University of Michigan | April | March | Y/Y | 2005 | 2004 | 2003 |
|---|---|---|---|---|---|---|
| Consumer Sentiment | 89.2 | 88.9 | 1.7% | 88.6 | 95.2 | 87.6 |
| Current Conditions | 111.1 | 109.1 | 6.4% | 105.9 | 105.6 | 97.2 |
| Expectations | 75.1 | 76.0 | -2.5% | 77.4 | 88.5 | 81.4 |
by Tom Moeller April 13, 2006
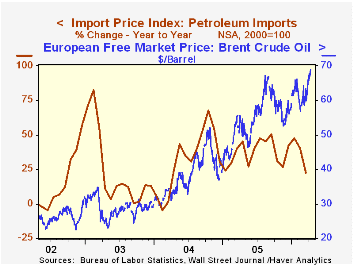
During March, total import prices fell a surprising 0.4% after an unrevised 0.5% drop the prior month. Consensus expectations had been for a 0.2% increase.
Unexpected was a 0.7% decline in petroleum prices. Crude oil prices dropped 0.5% (+20.6% y/y) but so far in April the price of Brent Crude is up sharply m/m and yesterday stood at $69.04 versus $62.12 per bbl. during March. 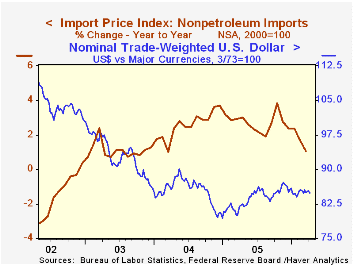
Nonpetroleum import prices fell 0.3% following a revised 0.6% February decline. Industrial materials prices less petroleum fell 1.3% (+7.3% y/y) owing to a 13.0% decline in natural gas prices (+19.1% y/y).
Prices for nonauto consumer goods fell 0.2% (-0.3% y/y) and capital goods prices fell 0.1% (-1.5% y/y). Excluding a 0.3% decline in computer prices, capital goods prices were unchanged (-6.5% y/y).
During the last ten years there has been a 66% (negative) correlation between the nominal trade-weighted exchange value of the US dollar vs. major currencies and the y/y change in non oil import prices. The correlation is a lower 47% against a broader basket of currencies and a lower 57% against the real value of the dollar.
Export prices rose 0.2%.
| Import/Export Prices (NSA) | Mar | Feb | Y/Y | 2005 | 2004 | 2003 |
|---|---|---|---|---|---|---|
| Import - All Commodities | -0.4% | -0.5% | 4.5% | 7.5% | 5.6% | 2.9% |
| Petroleum | -0.7% | -0.2% | 22.6% | 37.6% | 30.5% | 21.0% |
| Non-petroleum | -0.3% | -0.6% | 1.1% | 2.7% | 2.6% | 1.1% |
| Export - All Commodities | 0.2% | 0.1% | 2.2% | 3.2% | 3.9% | 1.6% |
by Tom Moeller April 13, 2006
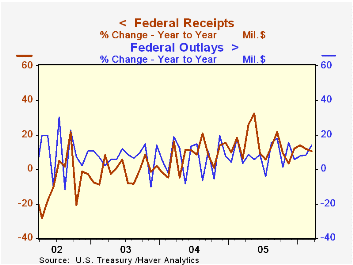
During March, the U.S. federal government again posted a deeper budget deficit versus the same month last year. The deficit of $85.5B versus last March's deficit of $71.2B pulled the FY06 to date budget deficit of $303.0B deeper versus 294.6B during the first six months of FY05.
Net revenues surged 45.8% m/m, made up for most of the February collapse and rose 10.5% during the first six months of this fiscal year versus FY05. The rate of gain in individual income tax receipts (44% of total receipts), however, slowed to 8.5% y/y though the gain in corporate income taxes (10% of total receipts) remained strong at 30.5% during fiscal year 06's first six months.
The improved job market raised employment taxes (36% of total receipts) 7.2% y/y and estate & gift taxes surged by 16.2% y/y.
U.S. net outlays jumped during March by 13.7% versus last March and the growth in FYTD outlays rose to 8.7%, the highest in nearly three years. Defense spending (19% of total outlays) surged 16.1% y/y and for the first six months of FY06 rose 8.9% from '05. The growth in Medicare spending (12% of total outlays) also jumped to 46.0% y/y and lifted FYTD growth to 15.5% while spending on social security (21% of total outlays) remained strong at 5.7%.
| US Government Finance | Mar | Feb | Y/Y | FY 2005 | FY 2004 | FY 2003 |
|---|---|---|---|---|---|---|
| Budget Balance | $-85.5B | $-119.2B | $-71.2B (3/05) | $-318.3B | $-412.7B | $-377.6B |
| Net Revenues | $164.6B | $112.9B | 10.6% | 14.5% | 5.5% | -3.8% |
| Net Outlays | $250.0B | $232.1B | 13.7% | 7.8% | 6.2% | 7.4% |
by Tom Moeller April 13, 2006
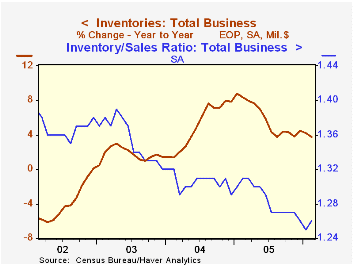
Total business inventories slipped marginally during February following an upwardly revised 0.6% gain during the prior month. Consensus expectations had been for a 0.3% increase for February.
Retail inventories reversed the prior month's downwardly revised 0.3% increase. Motor vehicle inventories fell 0.7% (0.0% y/y). Retail inventories less autos also fell marginally (+3.5% y/y) and January accumulation was revised down to 0.3% from 0.5%. Furniture inventories rose a strong 0.7% (6.6% y/y) and the prior month's gain was revised up but general merchandise inventories fell by 0.6% (+2.3% y/y) after a downwardly revised 0.4% decline during January. Apparel inventories rose 0.3% (2.3% y/y after a 0.4% January decline.
Wholesale inventories rose 0.8% due to a 1.0% gain in nondurables, lifted by broad based strength. Durables rose 0.6% (6.6% y/y). During the last ten years there has been a 67% correlation between the y/y change in wholesale inventories and the change in imports of nonpetroleum goods.
Factory sector inventories slipped 0.4% after an upwardly revised 1.1% January gain.
The inventory to sales ratio for total business rose modestly to 1.26 from an upwardly revised 1.25 during January.
| Business Inventories | Feb | Jan | Y/Y | 2005 | 2004 | 2003 |
|---|---|---|---|---|---|---|
| Total | -0.0% | 0.6% | 3.7% | 4.5% | 7.9% | 1.5% |
| Retail | -0.3% | 0.3% | 2.4% | 2.7% | 6.7% | 3.8% |
| Retail excl. Autos | -0.0% | 0.3% | 3.5% | 4.5% | 7.1% | 1.9% |
| Wholesale | 0.8% | 0.2% | 6.2% | 7.1% | 9.8% | 1.8% |
| Manufacturing | -0.4% | 1.1% | 3.2% | 4.4% | 7.7% | -1.1% |
by Carol Stone April 13, 2006
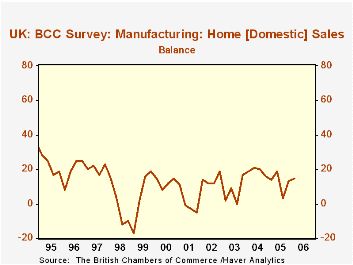
As in the Continental countries we discussed here yesterday, business in the UK is showing some signs of picking up. The British Chambers of Commerce Quarterly Economic Survey, the largest business survey in the UK, showed modest gains in nearly every one of its components for Q1 in both manufacturing and services segments.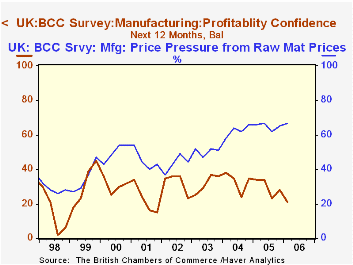
For Q1-2006 estimates of home sales (that is, domestic sales) by manufacturing firms ticked up 2 points to 15% from 13% in Q4; this reading is also very slightly higher than the 14% of Q1 2005. These survey results are percent-balances, that is, the proportion of companies reporting gains minus the proportion with declines. An advance in export sales was greater, to 23% from 12% in Q4, although the breadth of sales gains remains below the 26% of Q1 2005. Manufacturers feel somewhat comfortable with their general business pace, as a net of 43% look for improvement in turnover in the next 12 months. Profits are another matter, however, with a drop to 21% in confidence about increasing profits over the coming year, compared with 34% a year ago. Price pressures from raw materials and overhead costs are indicated by a rising number of manufacturing companies; labor costs, though, are a source of concern at the smallest number of firms since mid-2004.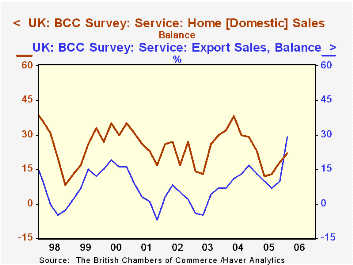
More service-sector firms than manufacturers are pleased with their current domestic sales pace, with a net of 22% reporting sales increases, up from 18% in Q4. This does, however, represent some slippage from Q1-2005, at 23%. After outright declines during 2001 and 2003, export sales are now expanding at an increasing number of service-producing companies, and some 29% report gains in Q1; this compares to 13% a year ago and just 10% for all of 2005.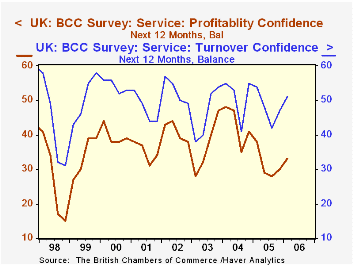 The Chambers of Commerce background information tells that about 20% of service companies engage in exporting. Service firms are generally more confident about the upcoming sales than are manufacturers; in Q1, 51% of them indicated satisfaction with their outlook for the year ahead. But, like manufacturers, they are worried about profits growth, with just 33% looking for increases. This is better than the four most recent quarters, but lower than 38% in Q1 2005. Their cost pressures resemble manufacturers', with upward forces on overhead expenses and raw materials, but a diminishing number experiencing rising labor costs.
The survey overall thus shows gains in basic business activity, but concern over profitability. Despite this uneasiness over profits, activity at both manufacturing and service companies is climbing, and in the coming year more firms look forward to gains in plant and equipment investment and employment.
| UK BCC Survey % Balances |
Q1 2006 | Q4 2005 | Q1 2005 | 2005 | 2004 | 2003 |
|---|---|---|---|---|---|---|
| Manufacturing: Home Sales | 15 | 13 | 14 | 12 | 19 | 7 |
| Export Sales | 23 | 12 | 26 | 17 | 17 | 4 |
| Turnover Confidence | 43 | 43 | 47 | 44 | 45 | 43 |
| Employment | 2 | 7 | 5 | 6 | 12 | -3 |
| Services: Home Sales | 22 | 18 | 23 | 17 | 32 | 21 |
| Export Sales | 29 | 10 | 13 | 10 | 12 | 1 |
| Turnover Confidence | 51 | 47 | 54 | 48 | 51 | 46 |
| Employment | 12 | 11 | 14 | 12 | 19 | 9 |

Tom Moeller
AuthorMore in Author Profile »Prior to joining Haver Analytics in 2000, Mr. Moeller worked as the Economist at Chancellor Capital Management from 1985 to 1999. There, he developed comprehensive economic forecasts and interpreted economic data for equity and fixed income portfolio managers. Also at Chancellor, Mr. Moeller worked as an equity analyst and was responsible for researching and rating companies in the economically sensitive automobile and housing industries for investment in Chancellor’s equity portfolio. Prior to joining Chancellor, Mr. Moeller was an Economist at Citibank from 1979 to 1984. He also analyzed pricing behavior in the metals industry for the Council on Wage and Price Stability in Washington, D.C. In 1999, Mr. Moeller received the award for most accurate forecast from the Forecasters' Club of New York. From 1990 to 1992 he was President of the New York Association for Business Economists. Mr. Moeller earned an M.B.A. in Finance from Fordham University, where he graduated in 1987. He holds a Bachelor of Arts in Economics from George Washington University.


