 Global| Nov 14 2006
U.S. Retail: Sales of Discretionary Items & Gasoline Lower
by:Tom Moeller
|in:Economy in Brief
Summary
During October, US retail sales fell for the fourth month in the last five. Last month's 0.2% drop was, however, a bit less than Consensus expectations for a 0.4% decline. Going the other way, September's decline was doubled to -0.8%. [...]
During October, US retail sales fell for the fourth month in the last five. Last month's 0.2% drop was, however, a bit less than Consensus expectations for a 0.4% decline. Going the other way, September's decline was doubled to -0.8%.
Falling gasoline prices accounted for much of the recent sales weakness. Last month gasoline station sales fell 6.0% (-12.5% y/y) after an 11.1% September drop that was deeper than initially reported. Gasoline prices fell 12.1% during October to an average $2.25 per gallon and this month have fallen another 1.3% to $2.22.
Sales by motor vehicle & parts dealers rose 0.6% (10.1% y/y) after an upwardly revised 0.7% September increase, though new unit vehicle sales fell 2.8% to 16.16M much of the difference reflected higher sales of automotive parts & accessories. Excluding autos, retail sales fell 0.4% following a deepened 1.2% decline during September.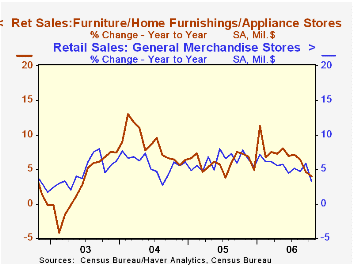
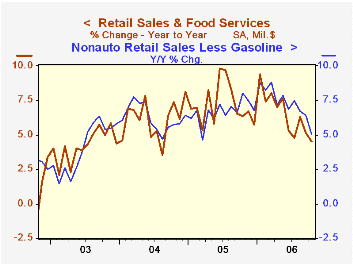
October nonauto retail sales less gasoline rose 0.3% (5.0% y/y) following a very much downwardly revised 0.2% gain during September.
Sales of discretionary items lost steam. Sales at furniture, home furnishings & appliance stores fell 0.4% (+4.0% y/y) after a downwardly revised 0.1% September dip while sales at general merchandise stores fell 0.3% (+3.2% y/y). Also to the downside, for the seventh month this year, were building material sales which fell 0.3% (+1.8% y/y) after a 1.8% September drop that was initially reported as a 1.1% rise.
Rising were apparel store sales by 0.1% (7.6% y/y) after a 2.9% September spike and food service (restaurant) & drinking service sales by 0.3% (7.8% y/y).
Sales of nonstore retailers (internet & catalogue) fell for the third straight month, down 0.1% (8.6% y/y).
The Rise in Homeownership from the Federal Reserve Bank of San Francisco is available here.
| October | September | Y/Y | 2005 | 2004 | 2003 | |
|---|---|---|---|---|---|---|
| Retail Sales & Food Services | -0.2% | -0.8% | 4.5% | 7.2% | 6.2% | 4.2% |
| Excluding Autos | -0.4% | -1.2% | 3.1% | 8.2% | 7.2% | 4.7% |
by Tom Moeller November 14, 2006
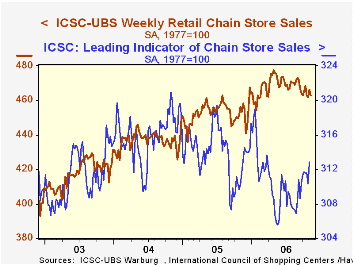
The ICSC-UBS retail chain-store sales index is constructed using the same-store sales (stores open for one year) reported by 78 stores of seven retailers: Dayton Hudson, Federated, Kmart, May, J.C. Penney, Sears and Wal-Mart.
The leading indicator of chain store sales from ICSC-UBS jumped 0.8% (0.8% y/y) last week after a 0.4% decline during the prior period.
| ICSC-UBS (SA, 1977=100) | 11/11/06 | 11/04/06 | Y/Y | 2005 | 2004 | 2003 |
|---|---|---|---|---|---|---|
| Total Weekly Chain Store Sales | 462.9 | 466.4 | 2.1% | 3.6% | 4.7% | 2.9% |
by Tom Moeller November 14, 2006
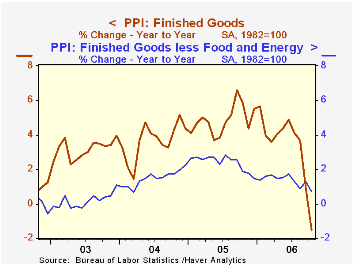
The overall producer price index fell 1.6% last month, about triple Consensus expectations. Lower energy prices again lowered the total but other prices fell as well. The core PPI fell 0.9% and more than reversed the prior month's recovery. It was the third decline in the last four months. Expectations had been for a 0.1% increase.
Finished energy goods prices fell 5.0% (-10.3% y/y), led lower by a 7.9% (-18.5% y/y) drop in gasoline prices but fuel oil prices rose 1.8% (-14.8% y/y). Natural gas prices dropped 9.3% (-19.2% y/y) and residential electric power costs fell 0.9% (+4.1% y/y).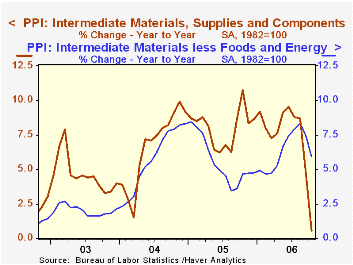
Finished consumer goods prices less food & energy. The 0.9% (+0.7% y/y) decline in October reversed the prior month's 0.6% rise and was the third decline in the last four months.
Capital equipment prices also reversed the prior month's increase with a 0.9% (+0.6% y/y) decline as light truck prices plunged 9.7% (-12.4% y/y).
Intermediate goods prices dropped 1.1% and prices less food & energy were unchanged.
The crude materials PPI plunged 10.5% due to the 9.4% (NSA, -8.2% y/y) drop in crude petroleum and a 39.6% collapse in natural gas (NSA, -66.8% y/y). Less food & energy crude goods prices reversed all of the prior month's strength with a 1.3% drop.
| Producer Price Index | October | September | Y/Y | 2005 | 2004 | 2003 |
|---|---|---|---|---|---|---|
| Finished Goods | -1.6% | -1.3% | -1.5% | 4.9% | 3.6% | 3.2% |
| Core | -0.9% | 0.6% | 0.7% | 2.4% | 1.5% | 0.2% |
| Intermediate Goods | -1.1% | -1.4% | 0.6% | 8.0% | 6.6% | 4.7% |
| Core | 0.0% | 0.1% | 5.9% | 5.5% | 5.7% | 2.0% |
| Crude Goods | -10.5% | -3.4% | -22.0% | 14.6% | 17.5% | 25.1% |
| Core | -1.3% | 1.0% | 20.0% | 4.8% | 26.5% | 12.4% |
by Louise Curley November 14, 2006
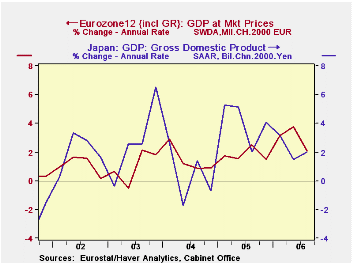
The third quarter preliminary estimate of Gross Domestic Product for Japan was twice as high as consensus expectations. On a seasonally adjusted annual rate, Japan's GDP rose 2.03% while the expected increase was 1.0%. The rise took place in spite of a 2.98% decline in consumer expenditures. This decline was, however, outweighed by a 2.92% increase in business fixed investment, an 11.18% increase in exports, a 0.57% decline in imports and a 2.0 trillion 2000 chained yen increase in inventories, the result, in part perhaps, of the decline in consumer spending.
For the Euro Zone as a whole, the preliminary 3rd quarter GDP rose 0.5% from the second quarter, slightly below the expectation of a 0.6% rise. On a seasonally adjusted annual rate basis, the rise was 2.1%, slightly higher than the rise in Japan. The first chart compares the annual rates of changes in GDP in Japan and the Euro Zone. (In the United States GDP rose 1.6% at an annual rate, in the third quarter.)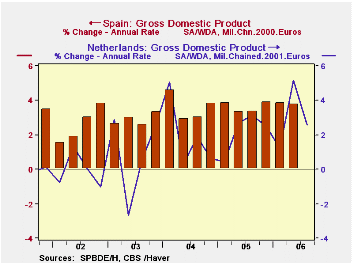
The performance among the Euro Zone countries was mixed. France, which reported its flash estimate earlier, showed no change in the third quarter after a 4.9% annual rate increase in the second quarter. Part of the poor performance was explained by working day effects. Apparently, INSEE over estimated the effects of a newly introduced June public holiday in the second quarter. Since not all workers took advantage of the holiday, the second quarter estimate was probably overstated and the third quarter understated.
Of the other Euro Zone countries reporting, Italy, the Netherlands, Spain and Germany, GDP growth decelerated in the third quarter. The deceleration was most marked in the Netherlands, Italy and Germany. The growth rate in the Netherlands fell to 2.57% in the third quarter from 5.15%in the second quarter. Comparable figures for Italy were 1.31% and 2.58%. and for Germany, 2.57% and 4.35%. The least deceleration was in Spain where the rise in the third quarter was 3.49% compared with 3.79% in the second quarter. The second chart compares the annual rates of change in GDP in Spain and the Netherlands. The relative stability in growth Spain contrasts with the more volatile growth in the Netherlands.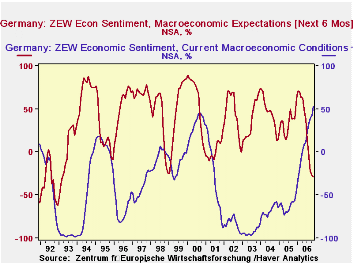
The German ZEW survey of institutional investors and financial analysts for November was released today. The participants continue to be pleased with the current situation. The excess of optimists over pessimists regarding the current situation rose to 53% in November, the highest percent balance in the history of the survey which was begun in December 1991. But the pessimists continue to dominate the expectations six months ahead. In November the excess of pessimists over optimists increased slightly to 28.5% from 27.4% in October. One has to go back to 1991 and 1993 to find larger excesses of pessimists. The third chart shows the opinions of the participants regarding the current situation and the expectations for six months ahead during the entire history of the ZEW survey.
| GROSS DOMESTIC PRODUCT (Percent change Q/Q AR) | Q3 06 | Q2 06 | Q1 06 | Q4 05 | Q3 05 | 2005 % | 2004 % | 2003 % |
|---|---|---|---|---|---|---|---|---|
| Japan | 2.03 | 1.51 | 3.17 | 4.09 | 2.03 | 2.69 | 2.13 | 1.96 |
| Euro Zone | 2.10 | 3.78 | 3.13 | 1.51 | 2.52 | 1.48 | 1.69 | 0.79 |
| United States | 1.58 | 2.56 | 5.55 | 1.76 | 4.18 | 3.22 | 3.91 | 2.51 |
| Germany | 2.57 | 4.35 | 3.24 | 1.09 | 2.08 | 1.10 | 0.77 | -0.20 |
| France | 0.00 | 4.91 | 1.79 | 1.11 | 2.78 | 1.19 | 2.03 | 1.19 |
| Italy | 1.31 | 2.58 | 3.13 | -0.07 | 1.28 | 0.11 | 0.88 | 0.11 |
| Netherlands | 2.57 | 5.15 | 1.23 | 2.51 | 3.11 | 1.53 | 1.95 | 0.34 |
| Spain | 3.49 | 3.79 | 3.86 | 3.90 | 3.36 | 3.53 | 3.45 | 2.96 |
| GERMANY ZEW INDICATOR (% BALANCE) |
Nov 06 | Oct 06 | Sep 06 | Aug 05 | Jul 05 | 2005 % | 2004 % | 2003 % |
| Current Conditions | 53.0 | 42.9 | 38.9 | 33.6 | 23.3 | -61.8 | -67.7 | -93.6 |
| Expectations 6 Months Ahead | -28.5 | -27.4 | -22.2 | -5.6 | 15.1 | 34.8 | 44.6 | 38.4 |

Tom Moeller
AuthorMore in Author Profile »Prior to joining Haver Analytics in 2000, Mr. Moeller worked as the Economist at Chancellor Capital Management from 1985 to 1999. There, he developed comprehensive economic forecasts and interpreted economic data for equity and fixed income portfolio managers. Also at Chancellor, Mr. Moeller worked as an equity analyst and was responsible for researching and rating companies in the economically sensitive automobile and housing industries for investment in Chancellor’s equity portfolio. Prior to joining Chancellor, Mr. Moeller was an Economist at Citibank from 1979 to 1984. He also analyzed pricing behavior in the metals industry for the Council on Wage and Price Stability in Washington, D.C. In 1999, Mr. Moeller received the award for most accurate forecast from the Forecasters' Club of New York. From 1990 to 1992 he was President of the New York Association for Business Economists. Mr. Moeller earned an M.B.A. in Finance from Fordham University, where he graduated in 1987. He holds a Bachelor of Arts in Economics from George Washington University.
More Economy in Brief


