 Global| Jan 13 2006
U.S. Retail Sales Light in December
by:Tom Moeller
|in:Economy in Brief
Summary
US retail sales rose 0.7% last month following an upwardly revised 0.8% increase in November. The increase, however, fell short of Consensus expectations for a 0.9% rise. In addition, sales less autos rose just half the expected 0.4% [...]
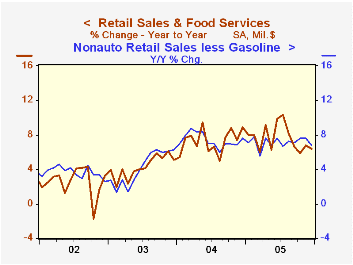
US retail sales rose 0.7% last month following an upwardly revised 0.8% increase in November. The increase, however, fell short of Consensus expectations for a 0.9% rise. In addition, sales less autos rose just half the expected 0.4% and the m/m decline in November was revised slightly deeper.
Discretionary spending faltered. Apparel store sales fell marginally after a downwardly revised 0.1% November decline (+7.1% y/y). General merchandise store sales also fell by 0.3% (+5.1% y/y) while sales of furniture, electronics & appliances were off 0.1% (+6.3% Y/Y). Sales at building material & supply dealers declined 0.6% (+9.7% y/y).
Sales at gasoline stations increased 0.9% despite a 3.2% decline in pump prices. Gas prices in January have reversed that decline and moved higher by 4.4% versus December.
Less gasoline, nonauto retail sales rose 0.1% (6.8% y/y), the weakest increase by far since July.
Sales of nonstore retailers (internet & catalogue) rose 0.5% (10.6% y/y) after an upwardly revised 0.4% increase during November.
| Dec | Nov | Y/Y | 2005 | 2004 | 2003 | |
|---|---|---|---|---|---|---|
| Retail Sales & Food Services | 0.7% | 0.8% | 6.4% | 7.6% | 7.3% | 4.3% |
| Excluding Autos | 0.2% | -0.4% | 8.0% | 8.6% | 8.2% | 4.7% |
by Tom Moeller January 13, 2006
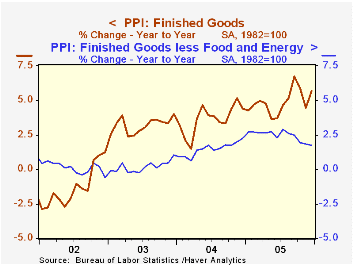
The Producer Price Index for Finished Goods doubled Consensus expectations for a 0.4% increase and posted a 0.9% gain in December. It was the strongest increase in four months and lifted the year to year rise to 4.9%, the strongest since 1990.
Energy prices rose a firm 3.1% (24.5% y/y) as gasoline prices reversed the prior month's decline and rose 12.3% (41.7% y/y). Home heating oil prices rose 2.7% (41.5% y/y) though residential natural gas prices slipped for the second month, down 2.7% (+29.2% y/y).
Strength in finished food prices accounted for much of last month's surprise. A 0.9% increase was the strongest since September but that lest the annual increase at 2.0%, less than half the 2004 rise.
"Core" producer prices rose the same 0.1% as during November and the gain was half the Consensus expectation for a 0.2% increase.
Prices of finished consumer goods less food & energy rose a modest 0.1% (2.0% y/y). Durable goods prices rose 0.1% (-0.2% y/y) after two months of decline. Capital equipment prices rose for the first month in three by 0.1% (1.3% y/y).
Intermediate goods prices rose a modest 0.2% and core intermediate goods prices increased 0.3%, the slimmest increase since August.
Crude goods prices fell sharply for the second consecutive month. The 2.3% decline reflected a 5.4% (+44.8% y/y) decline in energy prices. Core crude prices also slipped marginally after the 5.4% in November. During the last thirty years "core" crude prices have been a fair indicator of industrial sector activity with a 48% correlation between the six month change in core crude prices and the change in factory sector industrial production.
| Producer Price Index | Dec | Nov | Y/Y | 2005 | 2004 | 2003 |
|---|---|---|---|---|---|---|
| Finished Goods | 0.9% | -0.7% | 5.7% | 4.9% | 3.6% | 3.2% |
| Core | 0.1% | 0.1% | 1.7% | 2.4% | 1.5% | 0.2% |
| Intermediate Goods | 0.2% | -1.2% | 8.5% | 8.0% | 6.6% | 4.6% |
| Core | 0.3% | 0.5% | 4.4% | 5.4% | 5.7% | 2.0% |
| Crude Goods | -2.3% | -1.2% | 21.7% | 14.5% | 17.5% | 25.1% |
| Core | -0.0% | 5.4% | 4.5% | 4.9% | 26.6% | 12.4% |
by Tom Moeller January 13, 2006
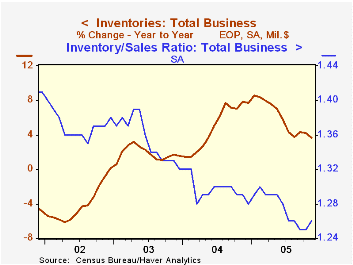
Total business inventories rose 0.5% in November. The gain followed a 0.4% October increase that was revised upward and it was squarely in the 0.4-0.5% range of the last four months. The increases raised slightly the ratio of inventories-to-sales back to 1.26, the 3Q average.
A 0.4% gain in inventories had been the Consensus expectation.
Retail inventories surged 0.9% after an upwardly revised 0.4% rise during October. A 2.1% (-3.1% y/y) rise in motor vehicle inventories followed large additions during the prior three months. Excluding autos, inventories rose 0.3% following an unrevised 0.1% fall during October. Clothing inventories fell 0.4% (+4.6% y/y), offset by a 0.4% gain in furniture inventories (5.1% y/y). General merchandise inventories rose a modest 0.2% (4.8% y/y).
The 0.4% rise in wholesale inventories doubled the October increase. During the last ten years there has been a 67% correlation between the y/y change in wholesale inventories and the change in imports of nonpetroleum goods.
Factory sector inventories rose just 0.2%, held back by a 3.2% decline in petroleum refineries' inventories. Less petroleum, factory inventories rose 0.3% (3.3% y/y).
| Business Inventories | Nov | Oct | Y/Y | 2004 | 2003 | 2002 |
|---|---|---|---|---|---|---|
| Total | 0.5% | 0.4% | 3.7% | 7.7% | 1.4% | 1.6% |
| Retail | 0.9% | 0.3% | 1.9% | 5.7% | 3.9% | 5.9% |
| Retail excl. Autos | 0.3% | -0.1% | 4.5% | 5.9% | 2.0% | 2.3% |
| Wholesale | 0.4% | 0.2% | 5.9% | 10.8% | 2.0% | 1.2% |
| Manufacturing | 0.2% | 0.6% | 3.8% | 7.7% | -1.1% | -5.4% |
by Carol Stone January 13, 2006
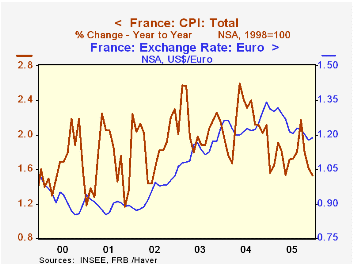
Inflation was modest across four European countries as 2005 ended, according to CPI data reported today. In France, the total index rose 0.2% in December from November and 1.5% from December 2004. This was even slower than the 2.1% in 2004. France's CPI excluding energy slowed for the year by a similar amount, to 1.1% from 1.5% across 2004. The slowing is concentrated in manufactured products, for which prices fell more than in 2004, and even in services, which rose 2.8% across 2005, less than the 3.3% in 2004.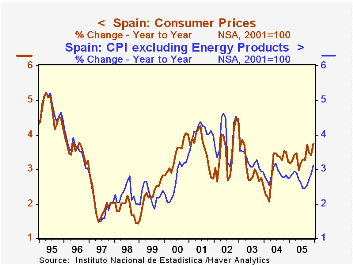
Consumer prices also moderated in Slovakia, although it has a much more inflation-prone economy. The index was up 0.6% in December, putting the year at 3.7%, markedly less than the 6.0% in 2004. The slowing was widespread, but variable. Housing and related expenses, for instance, were up 10.8%, but this was not as much as 13.8% in 2004. Price categories that firmed did so by decreasing less than they had in 2004, including such basic items as clothing and furniture. Even transportation costs rose more slowly, 3.3% versus 5.7%.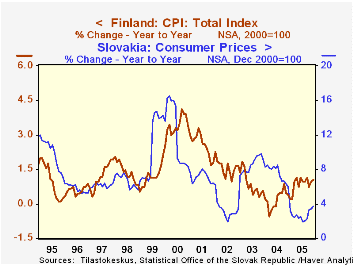
2005 inflation picked up in two other countries, however, Spain and Finland. In Spain, the total CPI rose 0.3% in the month of December and 3.8% across 2005; the yearly rate was 0.6 percentage point more than in 2004. Higher energy costs were surely an ingredient, but core inflation also rose, from 2.7% in 2004 to 3.1% last year. Finland, characterized by low CPI inflation generally, nonetheless saw its pace more than double last year to 1.0% from 0.4% in 2004. This seems to have been concentrated in alcoholic beverage prices, which fell in 2004 and then stabilized in 2005; other categories had variable price performance.
In all of these cases, large economies and small, highly developed and transitioning from socialism, inflation rates are generally restrained. "Inflation" is defined as "generalized" price increases throughout an economy, but all four of these have uneven price behavior both across categories and across time. So inflation remained well under control in Europe through 2005, a remarkable development after two years of notable energy price increases, and in those using the euro, a weakening currency for much of that time.
| CPI (% Change) ( NSA except as noted) |
Month/Month
December/December
|||||||
|---|---|---|---|---|---|---|---|
| Dec 2005 | Nov 2005 | Oct 2005 | 2005 | 2004 | 2003 | 2002 | |
| France (Months SA) | 0.2 | -0.1 | 0.0 | 1.5 | 2.1 | 2.2 | 2.3 |
| ex Energy | 0.3 | 0.1 | -0.1 | 1.1 | 1.5 | 2.4 | 2.1 |
| Spain | 0.3 | 0.2 | 0.8 | 3.8 | 3.2 | 2.6 | 4.5 |
| ex Energy | 0.4 | 0.5 | 1.0 | 3.1 | 2.7 | 2.9 | 4.3 |
| Finland | 0.1 | -0.3 | -0.1 | 1.0 | 0.4 | 0.6 | 1.7 |
| Slovakia | 0.6 | 0.5 | 1.5 | 3.7 | 6.0 | 9.2 | 3.4 |

Tom Moeller
AuthorMore in Author Profile »Prior to joining Haver Analytics in 2000, Mr. Moeller worked as the Economist at Chancellor Capital Management from 1985 to 1999. There, he developed comprehensive economic forecasts and interpreted economic data for equity and fixed income portfolio managers. Also at Chancellor, Mr. Moeller worked as an equity analyst and was responsible for researching and rating companies in the economically sensitive automobile and housing industries for investment in Chancellor’s equity portfolio. Prior to joining Chancellor, Mr. Moeller was an Economist at Citibank from 1979 to 1984. He also analyzed pricing behavior in the metals industry for the Council on Wage and Price Stability in Washington, D.C. In 1999, Mr. Moeller received the award for most accurate forecast from the Forecasters' Club of New York. From 1990 to 1992 he was President of the New York Association for Business Economists. Mr. Moeller earned an M.B.A. in Finance from Fordham University, where he graduated in 1987. He holds a Bachelor of Arts in Economics from George Washington University.
More Economy in Brief


