 Global| Sep 14 2007
U.S. Retail Sales in Line With Forecasts in August but Trend Down
by:Tom Moeller
|in:Economy in Brief
Summary
U.S. August, retail sales rose 0.3% after an upwardly revised 0.5% gain in July. The overall rise was in line with Consensus expectations for a 0.5% increase. A shortfall, however, was registered by sales excluding autos which fell [...]
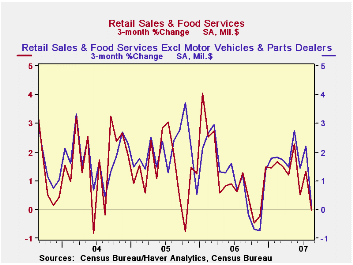
U.S. August, retail sales rose 0.3% after an upwardly revised 0.5% gain in July. The overall rise was in line with Consensus expectations for a 0.5% increase.
A shortfall, however, was registered by sales excluding autos which fell 0.4%. Any disappointment in that decline was mitigated by the upward revision to the July increase in sales to 0.7% from 0.4% reported initially. Consensus expectations were for a 0.2% gain in August.Nonauto retail sales less gasoline fell 0.1%r (4.9% y/y) after a July gain that was revised to 0.8% from 0.6% reported last month.
Sales of discretionary items were generally firm last month. Furniture, home furnishings & appliance stores rose 0.4% (2.5% y/y) after an upwardly revised 1.5% July increase that was nearly double the initial report. Sales at general merchandise stores rose 0.3% (5.6% y/y) after rising an unrevised 0.9% in July.Apparel store sales were the disappointment and fell 0.1% after a little revised 1.6% July.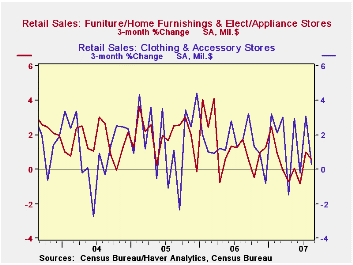
Reflecting weakness in the housing market, building material sales fell a hard 1.0% (-0.1% y/y) in August following a 0.8% July increase that was revised up from 0.2%.
Sales of nonstore retailers (internet & catalogue) fell 1.0% (+6.9% y/y) but the prior month's initially reported gain of 0.4% was revised up to 1.3%.
Sales by motor vehicle & parts dealers rose 2.8% (3.0% y/y) but the 0.3% increase that was reported last month was revised now to show a 1.4% decline. Unit vehicle sales jumped 6.5% in August, spurred by new sales promotions.
Gasoline service station sales fell 2.4% reflecting a 1.7% m/m decline in gas prices at the pump to an average $2.79 per gallon (-3.4% y/y). The decline has since bottomed.
| August | July | Y/Y | 2006 | 2005 | 2004 | |
|---|---|---|---|---|---|---|
| Retail Sales & Food Services | 0.3% | 0.5% | 3.7% | 6.2% | 6.6% | 6.1% |
| Excluding Autos | -0.4% | 0.7% | 3.9% | 7.3% | 7.6% | 7.1% |
by Tom Moeller September 14, 2007
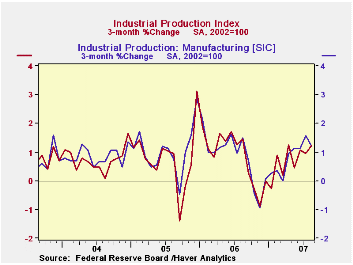
Industrial production rose an expected 0.2% following a little revised 0.5% July increase.
The "But" in the headline, however, is due to a 0.3% decline in factory output. It followed a 0.8% gain which was upwardly revised only a bit from 0.6%. August was the first decline in factory output since February.
A 2.1% decline in the output of automotive products led the decline in manufacturing output last month. Output of business equipment also fell by 0.2% (+3.7 y/y) owing to declines in the production of industrial equipment as well as defense & space equipment.
Consumer goods output rose a modest 0.1% (2.0%) y/y). Production of computers & electronics fell 0.3% (+17.8 y/y) for the second month to month decline and the output of furniture & appliances fell 0.5% (-4.9% y/y). The big loser was production of apparel which fell by 1.8% (-2.6% y/y) though a larger drop in July was revised shallower. The main increase in the consumer goods area was by chemical products with a 0.8% rise?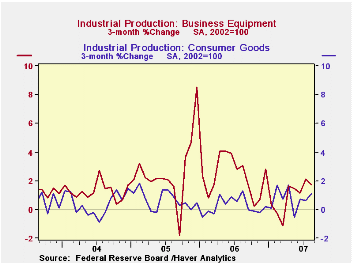
Capacity utilization rose to 81.9%from 81.8% in June as capacity rose 0.1% (2.1% y/y).
Blazing temperatures throughout the country during August accounts for the 5.3% rise in utility output, mainly driving air conditioners.
How Accurate Are Real-Time Estimates of Output Trends and Gaps? from the Federal Reserve Bank of Richmond can be found here.
| INDUSTRIAL PRODUCTION (SA) | August | July | Y/Y | 2006 | 2005 | 2004 |
|---|---|---|---|---|---|---|
| Total | 0.2% | 0.5% | 1.7% | 4.0% | 3.2% | 2.5% |
| Manufacturing | -0.3% | 0.8% | 1.7% | 4.7% | 3.9% | 2.9% |
| Mining | -0.7% | 0.8% | 0.5% | 2.7% | -1.6% | -0.6% |
| Utilities | 5.3% | -1.6% | 2.3% | 0.2% | 2.0% | 1.4% |
by Tom Moeller September 14, 2007
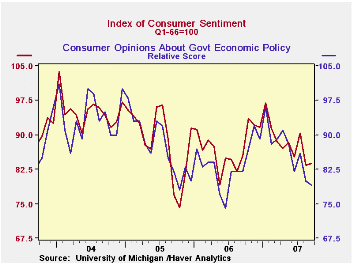
The University of Michigan's preliminary reading of consumer sentiment in early September rose 0.5% to 83.8. The increase about matched Consensus expectations for a reading of 83.5 but it was still near the lows of one year ago.
Improved consumer expectations accounted for all of the slight increase with a 0.9% rise to 74.4. Here again, this was near the lows of last year.
Long term, an improved expectation for business conditions during the next 5 years accounted for all of the rise in the expectations subcomponent. Expectations about personal finances and business conditions during the next year both fell.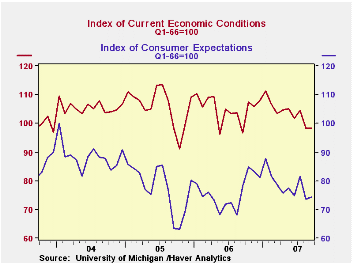
The view of the current economic conditions slipped 0.1% after a 5.8% slide during September. The view of current personal finances increased 1.9% (6.1% y/y) but the perspective of current buying conditions fell 1.3% for the second month slip.
The assessment of government policy fell for fifth month this year with a 1.2% (-37% y/y) decline on the heals of a 7.0% drop in August.
The University of Michigan survey is not seasonally adjusted.The reading is based on telephone interviews with about 500 households at month-end.
| University of Michigan | September (Prelim.) | August | September y/y | 2006 | 2005 | 2004 |
|---|---|---|---|---|---|---|
| Consumer Sentiment | 83.8 | 83.4 | -1.9% | 87.3 | 88.5 | 95.2 |
| Current Conditions | 98.3 | 98.4 | 1.8% | 105.1 | 105.9 | 105.6 |
| Expectations | 74.4 | 73.7 | -4.9% | 75.9 | 77.4 | 88.5 |
by Carol Stone September 14, 2006
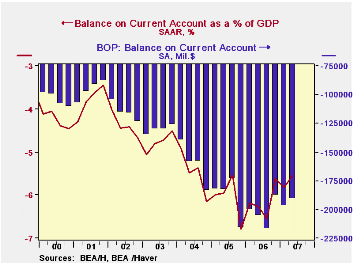
The US current account deficit shrank a bit in Q2 to $190.8 billion from $197.1 billion in Q1. The figure was very close to consensus expectations for Q2 of $190.5 billion. Q1's deficit was revised larger by $4.5 billion.
The latest deficit equaled 5.5% of GDP, down from 5.8% in Q1 and 6.2% for all of 2006.
The deficit in merchandise trade deteriorated slightly to $204.2B from Q1's deficit of $200.9B. Exports grew $9.2B in the quarter, equal to 3.4% (10.6% y/y). Imports increased 2.7% (4.3% y/y), but since imports are far larger, that is a $12.6B increase.
The surplus in services trade improved by $3.2B in the quarter to $26.5B, a new record. The previous high was $25.0B in Q4 1996. All major service sector categories contributed: more foreign tourists, less American use of foreign airlines, an increase in net private services, a gain in net royalties and fees and so on.
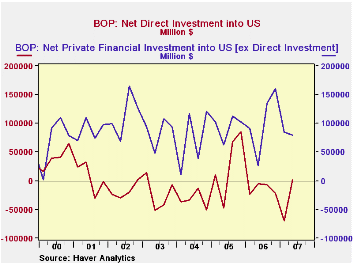
The U.S. capital account widened marginally in Q2 to $589 million, although this is noticeably smaller than the year-earlier $1.0 billion. Among the financial accounts, the net inflow of direct investment funds was $2.1B, a sharp turnaround from Q1's outsized outflow, $69.5B. Other private financial assets saw a net inflow of $79.2B, slightly less than $84.0B in Q1.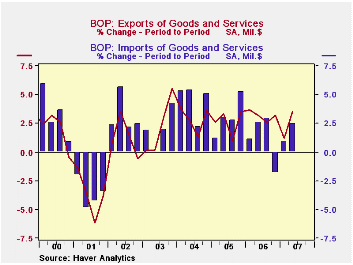
| US Balance of Payments, Bil.$, SA |
Q2 2007 | Q1 2007 | Q4 2006 | Year Ago | 2006 | 2005 | 2004 |
|---|---|---|---|---|---|---|---|
| Current Account Deficit | -190.8 | -197.1 | -187.9 | -205.6 | -811.5 | -754.8 | -640.2 |
| Goods & Services | -177.7 | -177.6 | -176.9 | -192.6 | -758.5 | -714.4 | -612.2 |
| Exports % change | 3.5% | 1.2% | 3.2% | 11.0% | 12.7% | 10.9% | 13.7% |
| Imports % change | 2.4% | 0.9% | -1.9% | 4.4% | 10.4% | 12.9% | 16.8% |
| Income (Bil.$) | +9.4 | +7.5 | +9.7 | +10.7 | +36.6 | +48.1 | +56.4 |
| Unilateral Transfers | -22.5 | 27.0 | 20.7 | 23.7 | 89.6 | 88.5 | 88.4 |
by Robert Brusca September 14, 2007
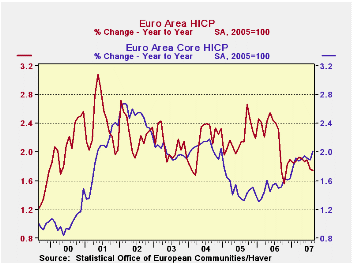
The table below flags higher period to period inflation with a red number. Cleary inflation’s acceleration is not a broad trend although the Y/Y pace for the core is up compared to last month (chart) and compared to its pace of one year ago (table). And inflation is up steadily and significantly for services; services make up a large portion of CPI prices. Goods inflation in the Euro area saw prices drop by 3.8% helping to contain the pressures from services prices. Still, services prices have accelerated steadily over six months compared to a year ago and over three months compared to six months. Surely equilibrium for this economy will not come with goods prices falling by nearly 3% at an annual rate. This brings to light the tenuous battle among the forces of inflation and deflation in the Euro area. While inflation trends are good for the month, the core rate is up over its 2% threshold and even though the core itself is not formally accelerating (in its sequential growth rates in the table) we can see a lot of pressures of various sorts pent up in the Euro area (goods Vs services) and evident in the Yr/Yr inflation plot, with the core accelerating and doing so ON TREND.
The continued rise in the euro could help to keep goods prices weak for some time, but the cauldron of brewing service sector inflation will not be much affected by that. We have already heard calls for FX intervention from one ‘wiseman’ in Germany (Bofinger) drawing attention to the adverse growth consequences of the strengthening euro. While most eyes are on the weakening dollar, it is the strengthening Euro that is doing the most damage. It will play a role in Euro area growth as well as in its inflation dynamics, a more problematic role, perhaps if the euro stops its rise and backtracks. That could put inflation back over the top of its range and the put the ECB on the hot seat at the same time the euro’s past strength has undermined growth.
| % mo/mo | % saar | ||||||
| Aug-07 | Jul-07 | Jun-07 | 3-Mo | 6-Mo | 12-Mo | Yr Ago | |
| EMU-13 | 0.0% | 0.1% | 0.2% | 1.4% | 2.2% | 1.7% | 2.3% |
| Core | 0.2% | 0.1% | 0.1% | 1.7% | 2.0% | 2.0% | 1.5% |
| Goods | 0.0% | -1.0% | 0.0% | -3.8% | 2.4% | 1.2% | 2.5% |
| Services | 0.2% | 0.8% | 0.2% | 5.0% | 3.8% | 2.6% | 1.9% |
| HICP | |||||||
| Germany | -0.1% | 0.2% | 0.2% | 1.2% | 1.8% | 2.0% | 1.7% |
| France | 0.3% | 0.0% | 0.2% | 2.3% | 2.7% | 1.3% | 2.1% |
| Italy | 0.2% | -0.1% | 0.3% | 1.5% | 1.6% | 1.7% | 2.3% |
| Spain | 0.0% | 0.2% | 0.3% | 2.0% | 2.7% | 2.2% | 3.8% |
| Core ex Food, Energy and Alcohol | |||||||
| Germany | 0.1% | 0.2% | 0.1% | 1.6% | 1.8% | 2.2% | 0.8% |
| France | 0.3% | 0.0% | 0.1% | 1.9% | 2.0% | 1.6% | 1.4% |
| Italy | 0.2% | 0.0% | 0.1% | 1.2% | 1.6% | 1.9% | 1.6% |
| Spain | 0.3% | 0.2% | 0.2% | 2.8% | 2.4% | 2.5% | 3.1% |
by Robert Brusca September 14, 2007
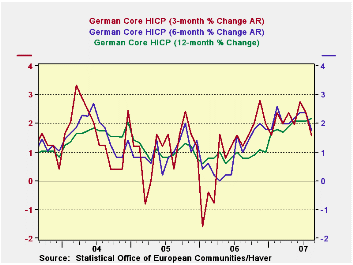
German inflation trends are mixed but on balance softer, kinder.
Inflation trends in Germany are cooling for both the core and headline in terms of their respective sequential rates of growth. The diffusion calculations at the table bottom look at accelerating Vs decelerating trends. A diffusion value above 50% shows more acceleration while below 50% shows less. While inflation has accelerated Yr/Yr over six months and three months it is ratcheting lower. The drop in Germany inflation’s pace seems to be authentic. As the Euro area's strongest economy and one where growth is also export-led, we should wonder how much of this is being induced by the strength of the euro. We have seen already reports of irregular output and sharply reduced orders growth in Germany. Is that the price Germany is paying for having such good inflation results?
| Mo/Mo % | Saar % | Yr/Yr | |||||
| Aug-07 | Jul-07 | Jun-07 | 3-Mo | 6-Mo | 12-Mo | Yr Ago | |
| HICP Total | -0.1% | 0.2% | 0.2% | 1.2% | 1.8% | 2.0% | 1.7% |
| Core | 0.1% | 0.2% | 0.1% | 1.6% | 1.8% | 2.2% | 0.8% |
| CPI | |||||||
| All | 0.1% | 0.3% | 0.1% | 1.8% | 2.7% | 2.0% | 1.7% |
| CPI excl Food & Energy | 0.2% | 0.1% | 0.1% | 1.5% | 2.0% | 2.0% | 0.8% |
| Food | 1.1% | 0.6% | 0.1% | 7.2% | 4.3% | 2.4% | 2.6% |
| Alcohol | 0.0% | 0.0% | 0.3% | 1.1% | 1.7% | 2.1% | 2.0% |
| Clothing & Shoes | -0.4% | -0.6% | -0.2% | -4.8% | -3.2% | 0.9% | -0.8% |
| Rent & Utilities | 0.1% | 0.2% | 0.2% | 1.8% | 1.4% | 1.4% | 2.7% |
| Health Care | 0.4% | 0.4% | 0.5% | 5.2% | 3.0% | 1.4% | 1.0% |
| Transport | -0.9% | -0.1% | 0.0% | -3.9% | 2.7% | 1.9% | 2.8% |
| Communication | 0.1% | -0.3% | -0.2% | -1.7% | -0.4% | 0.7% | -3.7% |
| Recreation & Culture | -1.1% | 1.3% | -0.1% | 0.4% | -0.6% | 0.8% | -0.4% |
| Education | 0.8% | -0.1% | 0.3% | 4.1% | 61.2% | 28.7% | 2.5% |
| Restaurant & Hotel | 0.0% | 0.0% | 0.0% | 0.0% | 1.6% | 2.6% | 1.0% |
| Other | 0.2% | 0.1% | 0.2% | 1.8% | 1.4% | 2.3% | 0.9% |
| Diffusion | -- | -- | -- | 45.5% | 36.4% | 72.7% | -- |
| Type: | Diffusion: Current Compared to | 6-mo | 12-mo | Yr-Ago | -- | ||
by Robert Brusca September 14, 2007
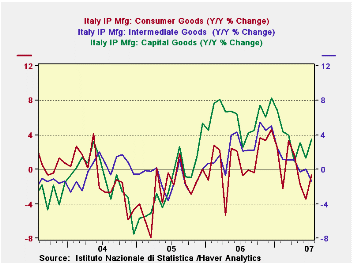
Italy joins the trend of EU members with weak IP in July. The UK and Germany are already there. For Italy the weakness is broad-based. Consumer goods output remains negative. Intermediate goods output also remains negative and is moving further in that direction. Only capital goods output is still positive but hovering at a weak rate of growth. The weakening in the Euro area encapsulates its largest and strongest economy, Germany, plus one of its large but weaker members, Italy. It is hard to tell how much it will spread. And we have yet to see what all the financial disturbances will do to growth in September and beyond.
| Saar except m/m | Jul-07 | Jun-07 | May-07 | 3-mo | 6-mo | 12-mo |
| IP-MFG | -0.4% | -0.7% | 0.4% | -2.9% | -3.8% | -0.2% |
| Consumer Goods | 0.5% | -1.5% | 0.3% | -2.5% | -4.1% | -0.6% |
| Capital Goods | 0.3% | -0.9% | 1.2% | 2.4% | -2.2% | 3.5% |
| Intermediate Goods | -1.5% | 0.0% | 0.6% | -3.3% | -4.3% | -1.4% |
| Memo | ||||||
| Transportation | -1.1% | 0.5% | 5.6% | 21.5% | 9.7% | 4.6% |

Tom Moeller
AuthorMore in Author Profile »Prior to joining Haver Analytics in 2000, Mr. Moeller worked as the Economist at Chancellor Capital Management from 1985 to 1999. There, he developed comprehensive economic forecasts and interpreted economic data for equity and fixed income portfolio managers. Also at Chancellor, Mr. Moeller worked as an equity analyst and was responsible for researching and rating companies in the economically sensitive automobile and housing industries for investment in Chancellor’s equity portfolio. Prior to joining Chancellor, Mr. Moeller was an Economist at Citibank from 1979 to 1984. He also analyzed pricing behavior in the metals industry for the Council on Wage and Price Stability in Washington, D.C. In 1999, Mr. Moeller received the award for most accurate forecast from the Forecasters' Club of New York. From 1990 to 1992 he was President of the New York Association for Business Economists. Mr. Moeller earned an M.B.A. in Finance from Fordham University, where he graduated in 1987. He holds a Bachelor of Arts in Economics from George Washington University.
More Economy in Brief


