 Global| Sep 14 2006
U.S. Retail Sales Gain Light; Gasoline Prices Fell
by:Tom Moeller
|in:Economy in Brief
Summary
In August, US retail sales rose a modest 0.2% following an unrevised July gain of 1.4%. Consensus expectations had been or a slight 0.1% decline. Sales by motor vehicle & parts dealers rose 0.4% (3.7% y/y) after a 4.3% surge in [...]
In August, US retail sales rose a modest 0.2% following an unrevised July gain of 1.4%. Consensus expectations had been or a slight 0.1% decline.
Sales by motor vehicle & parts dealers rose 0.4% (3.7% y/y) after a 4.3% surge in July.Behind the modest m/m gain was a 6.5% decline in unit vehicle sales to 16.06M, the lowest sales rate this year.
Excluding autos, retail sales also rose just 0.2% after a downwardly revised 0.6% July increase. Consensus expectations had been for nonauto retail sales to rise 0.3% last month.
Sales at gasoline stations also fell a hard 1.0% (+11.0% y/y) as gasoline prices fell during August 1.0% m/m to an average $2.95 per gallon. Gasoline prices have since fallen further to $2.62 per gallon last week.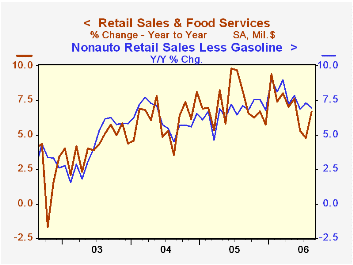
Less gasoline, nonauto retail sales rose 0.4% (7.0% y/y) after a downwardly revised 0.5% August increase.
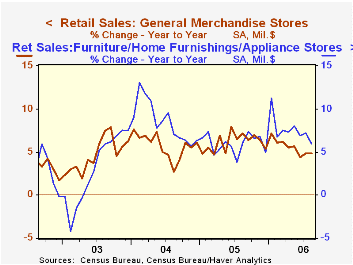
Sales of discretionary items were moderate last month. Furniture, electronics & appliances slipped 0.1% (+5.9% y/y) after July gain of 0.3% that was revised down from 1.2% reported initially. General merchandise stores rose 0.4% (4.9% y/y), better than the little-revised 0.2% July increase but apparel store sales fell 0.3% (+6.6% y/y). Sales of nonstore retailers (internet & catalogue) rose 0.3% (12.5% y/y) after a little revised 2.1% July spike.
Building material sales increased 0.1% (8.2% y/y) after a 0.3% July gain that was revised down from 1.9% in the initial report.
Survey Says Families Are Digging Deeper into Debt from the Federal Reserve Bank of St. Louis is available here.
| August | July | Y/Y | 2005 | 2004 | 2003 | |
|---|---|---|---|---|---|---|
| Retail Sales & Food Services | 0.2% | 1.4% | 6.7% | 7.2% | 6.2% | 4.2% |
| Excluding Autos | 0.2% | 0.6% | 7.5% | 8.2% | 7.2% | 4.7% |
by Tom Moeller September 14, 2006
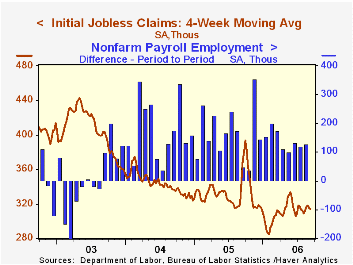
Initial claims for jobless insurance fell 5,000 last week to 308,000, repeating a slightly revised decline during the prior week. Consensus expectations had been for 315,000 claims and filings were at the lowest level in nearly two months.
During the last ten years there has been a (negative) 78% correlation between the level of initial claims and the m/m change in nonfarm payroll employment.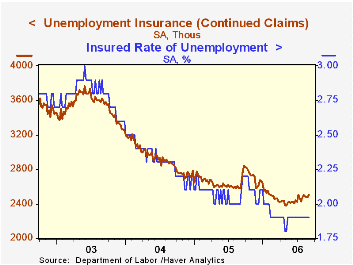
The four-week moving average of initial claims fell to 314,250 (-8.8% y/y), the lowest level in one month.
Continuing claims for unemployment insurance rose 18,000 following a downwardly revised 4,000 increase during the prior week.
The insured rate of unemployment was steady at 1.9% where it has been since February.
Former Speaker of the House Newt Gingrich Addresses Terrorist Threats from the American Enterprise Institute can be found here.
| Unemployment Insurance (000s) | 9/09/06 | 9/02/06 | Y/Y | 2005 | 2004 | 2003 |
|---|---|---|---|---|---|---|
| Initial Claims | 308 | 313 | -26.5% | 332 | 343 | 403 |
| Continuing Claims | -- | 2,499 | -3.4% | 2,662 | 2,924 | 3,532 |
by Tom Moeller September 14, 2006
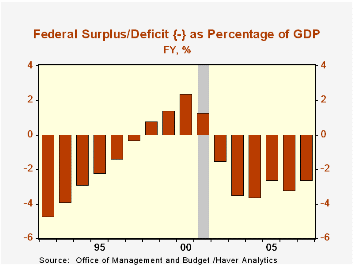
The August U.S. federal government budget deficit of $64.6B was double the July shortfall and deeper than August of last year. The figure compared favorably, however, to Consensus expectations for a $67.0B deficit, elevated due to calendar quirks.
The August shortfall pulled the eleven month fiscal year 2006 deficit to $304.3B, improved versus a deficit of $354.1B for the first eleven months of FY 2005.
The FY'06 budget deficit estimate of $295.8B offered last month by the Office of Management & Budget in its Mid-Session Review looks conservative. During the last several years the Gov't has run a surplus between $25B and $65B during September.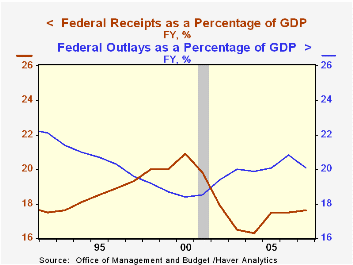
Net revenues grew 11.7% versus the first eleven months of FY'05. Individual income tax receipts (44% of total receipts) grew 12.4% as withheld taxes rose 7.9%, due to growth in employment, and non-withheld taxes surged 20.8%. Corporate income taxes (13% of total receipts) surged 29.0% as corporate profits grew. Estate & gift taxes increased by 14.2% while social insurance & retirement receipts grew 5.7%.
U.S. net outlays grew 7.6% compared with the first eleven months of FY'05. Defense spending (19% of total outlays) grew 6.0%. Medicare expenditures (12% of outlays) advanced 13.7% and social security spending (21% of outlays) rose 4.7%. Higher interest rates boosted the government's interest expense by 22.2% y/y to $212.9B so far this fiscal year.
| US Government Finance | August | July | Y/Y | FY 2005 | FY 2004 | FY 2003 |
|---|---|---|---|---|---|---|
| Budget Balance | -$64.6B | -$33.2B | -$51.3B (8/05) |
-$318.3B | -$412.7B | -$377.6B |
| Net Revenues | $153.9B | $159.8B | -1.0% | 14.5% | 5.5% | -3.8% |
| Net Outlays | $218.5B | $213.0B | 5.7% | 7.8% | 6.2% | 7.4% |
by Tom Moeller September 14, 2006
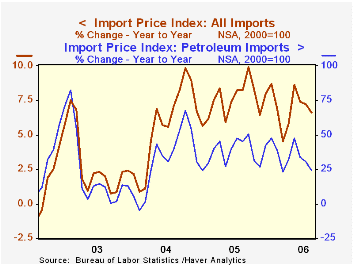
Total import prices rose 0.8% last month following an upwardly revised 1.0% increase during July. Consensus expectations had been for a 0.3% increase.
Less petroleum, import prices rose a firm 0.5%, the largest increase since May. Prices for nonoil industrial supplies & materials more than recouped a July decline with a 1.8% (11.4% y/y) surge led by higher prices for paper (7.9% y/y), chemicals (3.4% y/y) and metals (38.6% y/y).
During the last ten years there has been a 66% (negative) correlation between the nominal trade-weighted exchange value of the US dollar vs. major currencies and the y/y change in non oil import prices. The correlation is a lower 47% against a broader basket of currencies and a lower 57% against the real value of the dollar.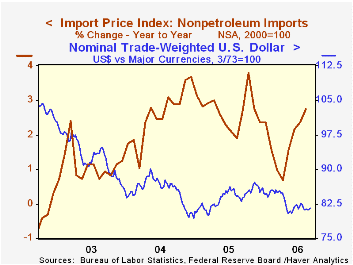
Capital goods prices rose 0.1% (-0.3% y/y) for the second month and rose 0.1% (1.9% y/y) excluding computers. Prices for nonauto consumer goods were unchanged (0.7% y/y) though prices for home entertainment equipment fell (-4.5% y/y).
Prices of petroleum imports jumped 2.3% after the 5.1% spike during July. Brent crude oil prices were about unchanged at $73.40 per barrel in August but have since fallen to $62.48.
Export prices rose 0.4% for the second consecutive month led by a 1.0% increase agricultural (3.5% y/y) and a 0.4% (5.3% y/y) rise in nonagricultural commodities.
| Import/Export Prices (NSA) | August | July | Y/Y | 2005 | 2004 | 2003 |
|---|---|---|---|---|---|---|
| Import - All Commodities | 0.8% | 1.0% | 6.6% | 7.5% | 5.6% | 2.9% |
| Petroleum | 2.3% | 5.1% | 24.3% | 37.6% | 30.5% | 21.0% |
| Non-petroleum | 0.5% | 0.0% | 2.7% | 2.7% | 2.6% | 1.1% |
| Export- All Commodities | 0.4% | 0.4% | 5.2% | 3.2% | 3.9% | 1.6% |
by Tom Moeller September 14, 2006
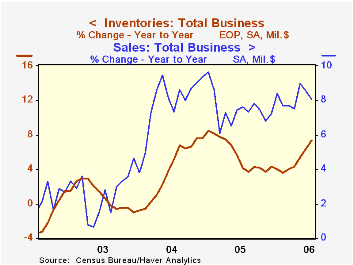
In July, total business inventories rose 0.6% following an upwardly revised 0.9% June gain. Consensus expectations had been for a 0.5% increase. That combination left the inventory to sales ratio stable m/m at 1.26, up from its low in May of 1.25.
Retail inventories rose 0.4% led by a 0.5% (15.3% y/y) surge in motor vehicles & parts. Excluding autos, retail inventories rose 0.3% (4.5% y/y). Furniture inventories moved up 4.9% y/y, while building materials inventories grew 8.7%. Clothing store inventories rose 5.5% y/y but inventories of general merchandise grew just 1.2%.
Wholesale inventories increased another 0.8% (8.8% Y/Y) in July led by a 1.2% (25.0% y/y) gain in petroleum inventories. Durables rose 9.2% y/y.
Factory inventories rose 0.6% (5.7% y/y), the fastest y/y rate of accumulation in a year.
| Business Inventories | July | June | Y/Y | 2005 | 2004 | 2003 |
|---|---|---|---|---|---|---|
| Total | 0.6% | 0.9% | 7.4% | 4.4% | 7.6% | -1.0% |
| Retail | 0.4% | 0.9% | 7.8% | 2.7% | 6.7% | 3.8% |
| Retail excl. Autos | 0.3% | 0.5% | 4.5% | 4.5% | 7.1% | 1.9% |
| Wholesale | 0.8% | 0.8% | 8.8% | 7.1% | 9.8% | 1.8% |
| Manufacturing | 0.6% | 0.9% | 5.7% | 4.0% | 6.9% | -7.4% |
by Carol Stone September 14, 2006
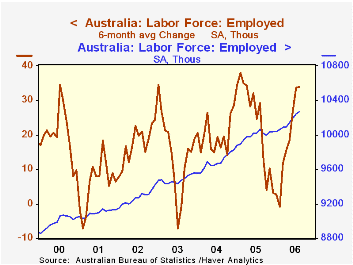
Employment in Australia rose 23,400 in August from July and has increased every month for the last ten. The year-on-year growth is just 2%, but the 10-month advance has occurred at a 3.2% annualized pace, similar to the 2005 performance.
This employment growth is strong enough to absorb sizable increases in labor force participation and still set record low unemployment rates. Unemployment stood at 4.9% of the labor force in August after touching 4.8% in July; until last August, it had never been as low as 5.0%. The rise in the participation rate includes an upturn among male workers since August 2004 after a secular decline that extends back almost continuously to the beginning of the data series in 1978. The participation rate for women continues to trend gradually higher.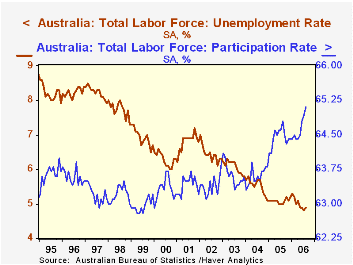
These broad labor force aggregates for Australia were published a week ago. Today, September 14, the Australian Bureau of Statistics published greater detail, including "quarterly" industry data. These industry data depart from the common use of the term quarterly; they are not averages or totals but figures that are simply collected only once a quarter, in the mid-month. Thus are "third quarter" readings already available before the actual end of the period. And in our table below, we show the whole array of data with their mid-month of quarter values to facilitate comparison.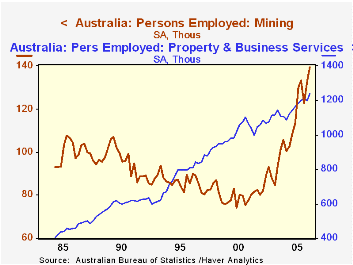
As in many "industrial" countries, Australia's manufacturing sector employment is lagging. However, the latest value, 1,054 persons, is ahead of the year-ago level by 13,000, marking the first year-on-year increase in six quarters. The mining sector seems small with only 139,000 employed in August, but it has been a source of growth particularly in metal ores. We mentioned this general characteristic of the Australian economy a couple of weeks ago (September 1) regarding movements in commodity prices there. Construction is growing vigorously, along with several service industries, especially property & business services and health & community services. Not shown in our table is a spurt in government employment, up 35,700 in the latest quarter, but this reflects temporary hiring for the 2006 Australian census. It will be important to check on Australian labor market conditions after the census has been taken and those temporary employees finish their assignments. ABS suggests that they have not inflated employment totals because many have other jobs already. Stay tuned to see how that plays out.
| Australia Labor Force* | Q3 2006 (Aug) | Q2 2006 (May) | Q3 2005 (Aug) | 2005 | 2004 | 2003 |
|---|---|---|---|---|---|---|
| Total Employment (000s) | 10,265 | 10,143 | 10,067 | 9,987 | 9,677 | 9,481 |
| Unemployment (000s) | 524 | 523 | 532 | 537 | 567 | 611 |
| Unemployment Rate (%) | 4.9 | 4.9 | 5.0 | 5.1 | 5.5 | 6.1 |
| Participation Rate (%) | 65.1 | 64.5 | 64.8 | 64.4 | 63.6 | 63.6 |
| Select Industries (000s) | ||||||
| Mining | 139 | 133 | 130 | 121 | 103 | 90 |
| Manufacturing | 1,054 | 1,060 | 1,041 | 1,070 | 1,089 | 1,082 |
| Construction | 899 | 888 | 870 | 867 | 802 | 755 |
| Property & Business Services | 1,233 | 1,196 | 1,197 | 1,171 | 1,108 | 1,112 |
| Health & Community Services | 1,072 | 1,089 | 1,023 | 1,013 | 981 | 932 |

Tom Moeller
AuthorMore in Author Profile »Prior to joining Haver Analytics in 2000, Mr. Moeller worked as the Economist at Chancellor Capital Management from 1985 to 1999. There, he developed comprehensive economic forecasts and interpreted economic data for equity and fixed income portfolio managers. Also at Chancellor, Mr. Moeller worked as an equity analyst and was responsible for researching and rating companies in the economically sensitive automobile and housing industries for investment in Chancellor’s equity portfolio. Prior to joining Chancellor, Mr. Moeller was an Economist at Citibank from 1979 to 1984. He also analyzed pricing behavior in the metals industry for the Council on Wage and Price Stability in Washington, D.C. In 1999, Mr. Moeller received the award for most accurate forecast from the Forecasters' Club of New York. From 1990 to 1992 he was President of the New York Association for Business Economists. Mr. Moeller earned an M.B.A. in Finance from Fordham University, where he graduated in 1987. He holds a Bachelor of Arts in Economics from George Washington University.
More Economy in Brief


