 Global| Mar 12 2010
U.S. Retail Sales Firm; "Core"Sales Rise To Highest Since 2008
by:Tom Moeller
|in:Economy in Brief
Summary
The gain in February sales, while small, was impressive. Retail sales rose 0.3% after a 0.1% January uptick that was revised down from the 0.5% increase reported last month. A 0.2% decline had been expected for February sales. On a [...]
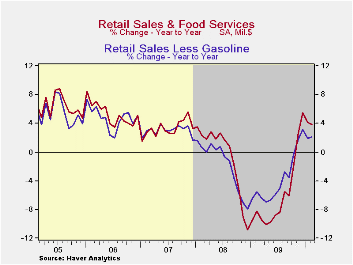
The gain in February sales, while small, was impressive. Retail sales rose 0.3% after a 0.1% January uptick that was revised down from the 0.5% increase reported last month. A 0.2% decline had been expected for February sales. On a three-month basis, sales rose at a 1.2% rate. Beyond the total, however, the numbers look better. Nonauto sales rose 0.8% after a 0.5% January increase that was little-revised. On a three-month basis nonauto sales rose at a respectable 4.8% annual rate, though that was less than half the peak rate of growth last November. These numbers were, of course, influenced by recently weak gains in gasoline prices. Nonauto retail sales less gasoline, a better measure of "core" spending, continued to improve last month at a 4.6% annual rate which was just off its November high of 7.2%. The growth returned the level of sales to its highest since August 2008.
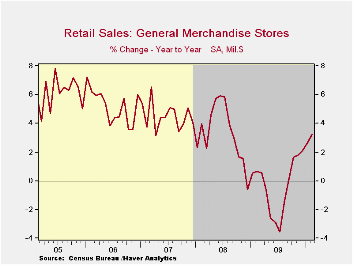
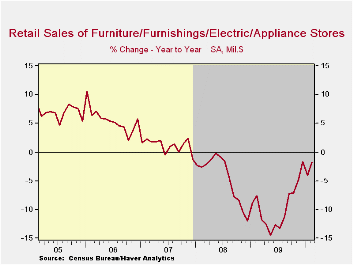
"Core" discretionary spending improved as furniture, home furnishings & electronics sales rose 2.2% and at a 9.8% annual rate over the last three months. That's improved from the 9.6% decline during all of last year and raised sales to the highest level in twelve months. Though furniture sales alone rose just 0.7% (-2.1% y/y), sales of electronics & appliances surged 3.7% (-1.6% y/y) after a 2.2% January increase. General merchandise store sales followed with a 1.0% gain (3.2% y/y) after a 1.3% January jump. Finally, apparel store sales gained 0.6% (-0.7% y/y) on the heels of a 1.5% January increase.
Motor vehicle sales have been the drag on recent spending. A 2.0% (+2.1% y/y) February slip was the third consecutive monthly decline which mirrored lackluster unit sales. Finally, growth in sales at gasoline service stations also has eased after last spring's surge with higher prices. February sales rose just 0.3% (24.0% y/y) and at a 6.3% rate during the last three months.
Earlier strength in internet & catalogue sales eased last month. Sales were unchanged but were still 11.8% higher than last year. The three-month rate of gain also eased off to 17.6%.
| February | January | December | Y/Y | 2009 | 2008 | 2007 | |
|---|---|---|---|---|---|---|---|
| Total Retail Sales & Food Services (%) | 0.3 | 0.1 | -0.2 | 3.9 | -6.0 | -0.8 | 3.3 |
| Excluding Autos | 0.8 | 0.5 | -0.1 | 4.2 | -4.8 | 2.4 | 3.9 |
| Non-Auto Less Gasoline | 0.9 | 0.5 | -0.2 | 2.0 | -1.9 | 1.6 | 3.6 |
by Robert Brusca March 12, 2010
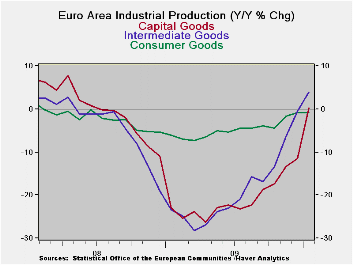
In a shocker of a report EMU IP ratcheted up much more than expected in January and the December reading got a boost due to revision as well. As a result industrial output now is growing 1.5% Yr/Yr in all of EMU. It is the first Yr/Yr rise in output since April of 2008. That leaves the index for output still some 17.2% below its cycle peak. While the Yr/Yr gain is good news and boosts output five percentage points, up from its cycle low, clearly there is a long way to go for Europe to get back where it was. Yr/Yr gains are a necessary, but not a sufficient condition for full recovery.
This is just another way of trying to find perspective. While the current IP rise is good news it represents only a baby step of progress. There are still many resources left idled by recession and the recession/ financial crisis already has dragged on for a long time – over two years in the case of the US. Clearly with such a large output gap in place (industrial output 17% off from its cycle peak) some resources could spend four years being idled (roughly two in recession and two in recovery) before they are used again. That is a stunning prospect. It also helps to explain why the recovery could well be stronger than what people are expecting. The economy’s ability to grow fast for an extended period of time is simply being underestimated. If EMU’s IP grew 8% per year for two years running it would still not quite be back to the past cycle peak and over that period, presumably, capacity itself would grow.
In Europe the broad social welfare net provides a deeper cushion for more people compared to the assistance offered in the US. Arguably it makes the US recession more painful and that prods the economy and its workers more sharply to find a solution more quickly.
Tax cuts and incentives may help. But these sorts of things must be very carefully crafted or they just wind up being give-aways with no real stimulus.
It’s a good thing Europe is growing more briskly since this problem in Greece is going to notch up the head winds for Europe to some extent. Already it has unleashed a firestorm of protests within Greece, produced cries for trading reforms especially on credit default swaps and it has brought out some of the under the surface tensions in EMU as German Finance Minister Wolfgang Schaeuble called for “prohibitive” sanctions including expulsion from the euro region as the ultimate penalty for countries that repeatedly flout debt rules. This is chilling stuff and a full 180 degrees from Sarkozy saying if Greece goes bankrupt, Europe will have failed. Europe remains quite heterogeneous. Perhaps that is what European nations have most in common.
The brighter more robust economic backdrop is a breath of fresh air. More to the point it signals a stronger economic tail wind than what we thought we had before. It can help so stave off the effects of the harsher political head winds that suddenly have emerged. All this underscores the nature of recovery data, that they can run hot and cold, seemingly for no reason whatsoever. And in the wake of recession, along with recovery, there often there is other fallout and the pitfalls that such events bring.
That is why this recession is a real recession, not the recession-lite of 1990 or of 2001. In those episodes the central banks eased the pain early and essentially excesses have been piling up ever since. It takes a good recession to purge the system of its hidden abuses, or abusers, like Bernie Madoff. Had markets continued to rise, Bernie would have escaped detection along with others like him and his scam would have gotten bigger and more damaging. Recessions have a role in economics and although they are bad, they are cleansing. The key is to pick up the pieces and do better next time. If we do the next cycle will less painful. Can we do it?
| Euro-Area MFG IP | ||||||||||
|---|---|---|---|---|---|---|---|---|---|---|
| Saar except m/m | Mo/Mo | Jan 10 |
Dec 09 |
Jan 10 |
Dec 09 |
Jan 10 |
Dec 09 |
|||
| Euro-Area Detail | Jan 10 |
Dec 09 |
Nov 09 |
3Mo | 3Mo | 6mo | 6mo | 12mo | 12mo | Q-4 |
| MFG | 1.8% | 0.2% | 1.4% | 14.1% | 6.2% | 9.6% | 6.5% | 1.5% | -4.4% | 14.9% |
| Consumer | -0.1% | 0.4% | 1.3% | 6.8% | 2.7% | 0.8% | 1.4% | -0.8% | -0.8% | 3.8% |
| C-Durables | 2.0% | -0.8% | 1.7% | 11.8% | 4.4% | 10.7% | 8.2% | -2.5% | -6.5% | -- |
| C-Non-durables | -0.3% | 0.6% | 0.9% | 5.1% | 0.8% | -0.2% | 1.1% | -0.3% | -0.2% | -- |
| Intermediate | 1.4% | -1.4% | 0.6% | 2.4% | 1.6% | 5.7% | 7.9% | 4.0% | -0.5% | 3.9% |
| -0.3% | -0.2% | 1.5% | 3.8% | 2.6% | 7.3% | 5.5% | 0.2% | -11.6% | 0.1% | |
| Main Euro-Area Countries and UK IP in MFG | ||||||||||
| Mo/Mo | Jan 10 |
Dec 09 |
Jan 10 |
Dec 09 |
Jan 10 |
Dec 09 |
||||
| MFG Only | Jan 10 |
Dec 09 |
Nov 09 |
3Mo | 3Mo | 6mo | 6mo | 12mo | 12mo | Q:4 Date |
| Germany: | 0.9% | -1.2% | 0.9% | 2.5% | -8.3% | 9.3% | 5.2% | 3.6% | -5.7% | 1.4% |
| France: IPxConstruct'n |
1.6% | -0.2% | 0.8% | 8.8% | 1.8% | 6.0% | 5.1% | 3.5% | -1.8% | 2.6% |
| Italy | 2.8% | 0.2% | 0.9% | 17.0% | 9.4% | 12.1% | 9.2% | 0.0% | -5.5% | 3.6% |
| Spain | -3.0% | -0.6% | -0.1% | -14.1% | -4.7% | -6.6% | 1.2% | -1.6% | -2.4% | -11.2% |
| UK: EU member | -0.8% | 0.9% | 0.1% | 0.9% | 4.1% | -0.4% | 2.0% | 0.2% | -2.0% | 4.0% |
by Tom MoellerMarch 12,2010
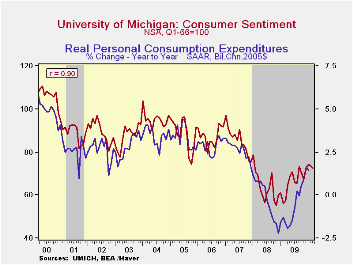
Consumers' mood became a bit more cautious this month but not enough to suggest a real darkening. The University of Michigan reported that its index of consumer sentiment dipped to 72.5 at mid-March from 73.6 during February. Consensus expectations were for 73.8.The index reached a high of 74.4 in January. Nevertheless, sentiment remained 26.5% higher than last year. During the last ten years there has been a 90% correlation between the level of sentiment and the y/y change in real consumer spending.
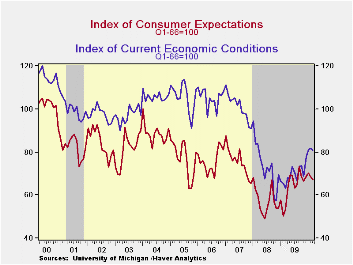
The index of expected economic conditions eased 1.8% m/m to the lowest level since November. Expectations for business conditions during the next year fell but during the next five years they rose moderately. Expectations for personal finances were stable at the lowest level in twelve months.
Sentiment about current economic conditions slipped to the lowest level since December. The assessment of current personal finances (14.1% y/y) and buying conditions for large household goods, including furniture, refrigerators, stoves & televisions (37.8% y/y) both slipped.
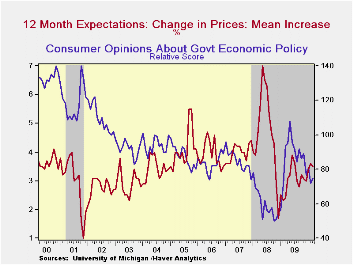
Expected price inflation during the next year dipped just slightly to 3.5% but was up from the December 2008 reading of 1.7%.Respondents' view of government policy, which may eventually influence economic expectations, improved modestly m/m but remained down 30.6% from its high last May. Fifteen percent of respondents thought that a good job was being done by government versus 40% who thought a poor job was being done, a twelve-month high.
| University of Michigan | Mid-March | February | January | March y/y | 2009 | 2008 | 2007 |
|---|---|---|---|---|---|---|---|
| Consumer Sentiment | 72.5 | 73.6 | 74.4 | 26.5% | 66.3 | 63.8 | 85.6 |
| Current Conditions | 80.8 | 81.8 | 81.1 | 27.6 | 69.6 | 73.7 | 101.2 |
| Expectations | 67.2 | 68.4 | 70.1 | 25.6 | 64.1 | 57.3 | 75.6 |
by Tom MoellerMarch 12, 2010
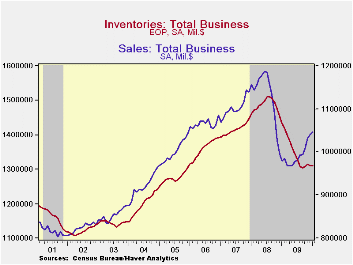
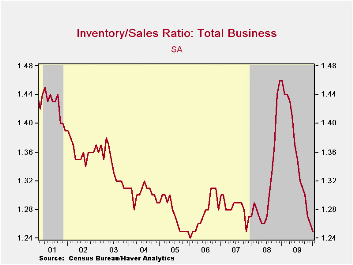
There seems to be no hurry for businesses to accumulate inventories. A modest drop in January inventories followed a December decline that was little-revised. It left the rate of decline just a little less than at the peak rate of decumulation last summer. This drop occurred at the same time as a 0.6% increase (6.8% y/y) in January business sales. As a result, the inventory/sales ratio fell to the lowest level since late-2007.
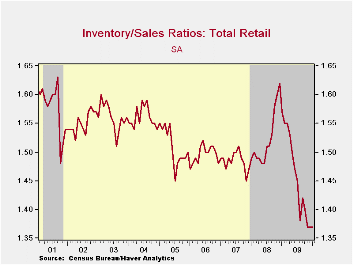
Retailers' inventory/sales ratio remains at their cycle low. The I/S ratio for apparel stores fell to a record low as inventories fell 9.3% y/y. The I/S ratio for general merchandise stores also fell to a record low. Wholesalers' ratio also was at the record low while the I/S ratio in the factory sector fell to the lowest level since August 2008.
During the last few months, these depressed ratios reflect little inclination by business to accumulate inventories which have been flat across industries. Notably, the retail and wholesales sectors continue to shed inventories despite higher sales. The factory sector seems to feel the same way despite a modest January uptick in inventory levels.
The business sales and inventory data are available in Haver's USECON database.
| Business Inventories (%) | January | December | November | Y/Y | 2009 | 2008 | 2007 |
|---|---|---|---|---|---|---|---|
| Total | -0.0 | -0.3 | 0.5 | -8.6 | -9.8 | 0.4 | 4.0 |
| Retail | -0.1 | 0.2 | -0.2 | -8.7 | -10.6 | -3.3 | 2.5 |
| Retail excl. Auto | -0.2 | 0.4 | -0.3 | -4.4 | -4.9 | -1.9 | 2.7 |
| Wholesale | -0.2 | -1.0 | 1.6 | -9.7 | -10.4 | 2.5 | 6.2 |
| Manufacturing | 0.2 | -0.2 | 0.2 | -7.5 | -8.7 | 2.2 | 3.7 |

Tom Moeller
AuthorMore in Author Profile »Prior to joining Haver Analytics in 2000, Mr. Moeller worked as the Economist at Chancellor Capital Management from 1985 to 1999. There, he developed comprehensive economic forecasts and interpreted economic data for equity and fixed income portfolio managers. Also at Chancellor, Mr. Moeller worked as an equity analyst and was responsible for researching and rating companies in the economically sensitive automobile and housing industries for investment in Chancellor’s equity portfolio. Prior to joining Chancellor, Mr. Moeller was an Economist at Citibank from 1979 to 1984. He also analyzed pricing behavior in the metals industry for the Council on Wage and Price Stability in Washington, D.C. In 1999, Mr. Moeller received the award for most accurate forecast from the Forecasters' Club of New York. From 1990 to 1992 he was President of the New York Association for Business Economists. Mr. Moeller earned an M.B.A. in Finance from Fordham University, where he graduated in 1987. He holds a Bachelor of Arts in Economics from George Washington University.
More Economy in Brief


