 Global| Jan 12 2007
U.S. Retail Sales Firm At Yearend Led By Electronics
by:Tom Moeller
|in:Economy in Brief
Summary
US retail sales in December rose 0.9% though the sales gain during the prior month was lowered to 0.6% from 1.0% reported initially. The latest increase again easily beat Consensus expectations for a 0.6% rise. Excluding autos, retail [...]
US retail sales in December rose 0.9% though the sales gain during the prior month was lowered to 0.6% from 1.0% reported initially. The latest increase again easily beat Consensus expectations for a 0.6% rise.
Excluding autos, retail sales jumped a larger 1.0% last month, though the November gain was lowered to a still firm 0.7% from 1.1%. Sales by motor vehicle & parts dealers rose 0.3% (3.6% y/y) after a downwardly revised slight decline in November, as new unit vehicle sales did rise 4.4% in December.
Sales at gasoline service stations jumped 3.8% reflecting the 3.7% recovery in gasoline prices to $2.31 per gallon.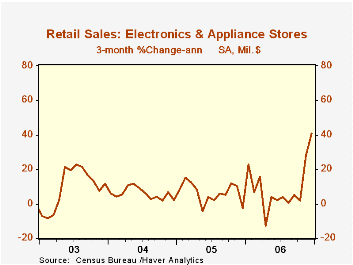
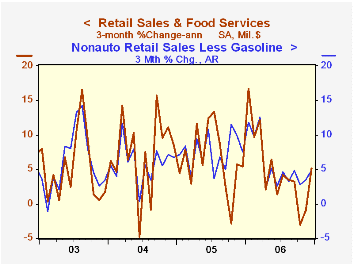
Nonauto retail sales less gasoline in November jumped 0.7% (6.2% y/y) though the November gain was revised lower to 0.5% from 0.9% reported initially. During the fourth quarter these sales rose at a 3.7% annual rate, the versus 4.2% during 3Q.
Sales of discretionary items were generally firm last month. Sales at furniture, home furnishings & appliance stores jumped 1.8% (11.1% y/y) after an upwardly revised 2.8% November spike. Sales at electronics & appliance stores surged 3.0% (15.0% y/y) after a 5.8% November surge. Apparel store sales gained 0.6% (5.5% y/y) after two months of decline and general merchandise store sales rose 0.9% (5.4% y/y).
Building material sales fell 1.1% (-0.8% y/y), the eighth decline in the last nine months. Sales of nonstore retailers (internet & catalogue) rose a modest 0.3% (7.9% y/y) but restaurant and bar sales jumped 2.3% (9.3% y/y).
| December | November | Y/Y | 2006 | 2005 | 2004 | |
|---|---|---|---|---|---|---|
| Retail Sales & Food Services | 0.9% | 0.6% | 5.4% | 6.3% | 7.2% | 6.2% |
| Excluding Autos | 1.0% | 0.7% | 5.8% | 7.5% | 8.3% | 7.2% |
by Tom Moeller January 12, 2007
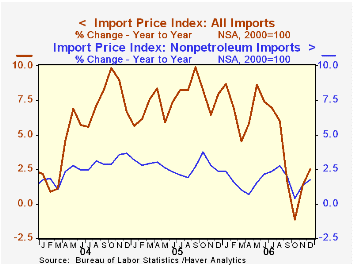
Higher petroleum prices fueled a 1.1% jump in overall import prices last month which was about double Consensus expectations for a 0.6% gain.
The increase occurred as petroleum import prices surged 4.8% in December after sharp declines during the prior three months. So far in January the price of WTI crude oil has fallen roughly six dollars (-10%) from the $62.03 per bbl. averaged in December and yesterday's price was down ten dollars to $51.89.
Less petroleum import prices rose 0.4% in December and the prior month's increase was revised up to 0.9% from 0.7%. During the last ten years there has been a 66% (negative) correlation between the nominal trade-weighted exchange value of the US dollar vs. major currencies and the y/y change in non oil import prices. The correlation is a lower 47% against a broader basket of currencies.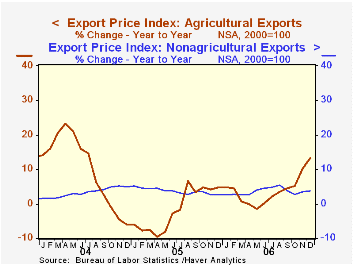
Prices for nonoil industrial supplies & materials surged 1.5% (4.5% y/y) after a 4.0% November spike. Prices for nondurable industrial supplies less petroleum rose 2.6% (-5.8% y/y) after an upwardly revised 8.9% November jump. Prices for durable industrial supplies & materials rose 0.7% (14.7% y/y).
Capital goods prices ticked up 0.1% (0.4% y/y) and excluding a 0.1% (-3.6% y/y) decline in computers, capital goods prices rose 0.2% (2.2% y/y) in December. Prices for nonauto consumer goods rose 0.2% (1.2% y/y).
Export prices rose 0.7% as agricultural export prices surged 2.2% (13.2% y/y) but nonagricultural export prices rose 0.5% (3.8% y/y).
The Adjustment of Global External Imbalances: Does Partial Exchange Rate Pass-through to Trade Prices Matter? from the Federal Reserve Board is available here.
The Internationalization of the Dollar and Trade Balance Adjustment from the Federal Reserve Bank of New York can be found here.
| Import/Export Prices (NSA) | December | November | Y/Y | 2006 | 2005 | 2004 |
|---|---|---|---|---|---|---|
| Import - All Commodities | 1.1% | 0.5% | 2.5% | 4.9% | 7.5% | 5.6% |
| Petroleum | 4.8% | -1.2% | 6.2% | 20.7% | 37.6% | 30.5% |
| Non-petroleum | 0.4% | 0.9% | 1.7% | 1.7% | 2.7% | 2.6% |
| Export- All Commodities | 0.7% | 0.4% | 4.6% | 3.6% | 3.2% | 3.9% |
by Tom Moeller January 12, 2007
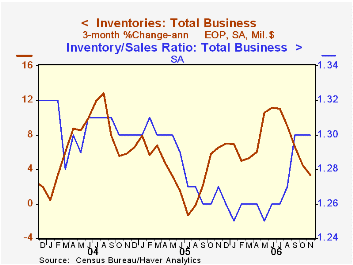
Total business inventories rose 0.4% in November following a downwardly revised 0.2% October gain. Consensus expectations had been for a 0.3% rise and over the last three months the 0.3% average increase was the slowest since September of last year.
During the last ten years there has been a 57% correlation between the y/y change in business inventories and the change in factory sector industrial production. Using quarterly figures, there has been an 84% correlation between the change in real private nonfarm inventories and production.
Business sales rose 0.5% (4.0% y/y), the first increase in three months. Wholesale sales led the gain with a 1.0% (7.95 y/y) pop and retail sales rose 0.6% (4.3% y/y). Factory shipments ticked up 0.1% (0.7% y/y). As a result the inventory to sales ratio was stable at 1.30 for the third month.
Retail inventories fell for the third straight month but excluding autos they rose 0.3%. General merchandise inventories rose 0.2% (2.9% y/y) and have been accumulating strongly since May. Clothing store inventories surged 1.6% (9.7% y/y), the third month of strong gain. Furniture inventories fell for the second month with a 0.2% decline (+4.3% y/y).
| Business Inventories | November | October | Y/Y | 2005 | 2004 | 2003 |
|---|---|---|---|---|---|---|
| Total | 0.4% | 0.2% | 6.9% | 4.4% | 7.6% | -1.0% |
| Retail | -0.3% | -0.2% | 4.0% | 2.7% | 6.7% | 3.8% |
| Retail excl. Autos | 0.3% | 0.2% | 4.6% | 4.5% | 7.1% | 1.9% |
| Wholesale | 1.3% | 0.4% | 10.1% | 7.1% | 9.8% | 1.8% |
| Manufacturing | 0.2% | 0.3% | 7.1% | 4.0% | 6.9% | -7.4% |
by Carol Stone January 12, 2007
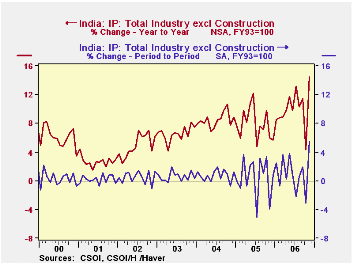
Industrial production in India was strong again in November, extending a long but irregular uptrend in the industrial sector of that rapidly emerging economy. According to the Central Statistical Organization, IP was up 5.5% in the month and 14.4% on the year. The CSO data are not seasonally adjusted. The month-to-month comparison quoted here is taken from seasonal adjustment performed by Haver Analytics. Because the month-to-month movements are very erratic, our discussion below covers yearly growth trends both in the latest month and over a longer period.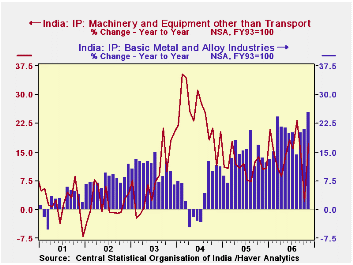
Marked acceleration of even heavy industry is evident in the categorical breakdown. Basic metals and alloys surged by 25.4% over November 2005, a third consecutive month of 20%-plus yearly gains. Machinery excluding transport equipment expanded 17.3% in November and the last six months have run 14.9% ahead of the comparable year-ago period. Nonmetallic mineral products have a similar pattern, with November up 17.7% and the last six months up 13.8% on the year-ago period.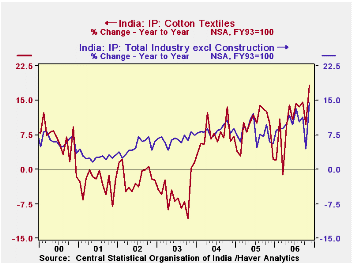
Among "softer" products, rubber, plastics and petroleum expanded 23.2% in November and 13.1% in the six-month period. This follows a particularly weak performance over the prior five years. Cotton textiles, the kind of manufacturing often associated with India, had experienced a long period of little or no growth, but has lately staged a comeback. By November 2006, production here was up 18.3% from November 2005 and the six months are up 13.5% from the same time in 2005.
The service sector in India remains far larger than manufacturing, measured by gross value added. But these gains in industrial production show a significant diversification of the Indian economy. While every nation need not be a major player in world metals markets or motor vehicles, the breadth of recent gains -- especially the return of strength in textiles -- gives a firmer foundation for further development.
| India (NSA, yr/yr % changes) | Nov 2006 | Oct 2006 | Sept 2006 | 2005 | 2004 | 2003 |
|---|---|---|---|---|---|---|
| General Industrial Production (SA, FY93=100) |
250.9 | 237.9 | 245.5 | 216.7 | 200.8 | 185.2 |
| Mo/Mo % Chg, SA | 5.5 | -3.1 | 1.9 | -- | -- | -- |
| Yr/Yr % Chg, NSA | 14.4 | 4.4 | 11.4 | 7.9 | 8.5 | 6.6 |
| Manufacturing | 15.7 | 3.8 | 12.0 | 9.0 | 8.9 | 7.1 |
| Cotton Textiles | 18.3 | 9.7 | 14.7 | 9.1 | 7.4 | -5.3 |
| Rubber, Plastic, Petroleum | 23.2 | 7.7 | 15.7 | 3.9 | 1.2 | 7.2 |
| Basic Metals & Alloys | 25.4 | 20.9 | 20.0 | 13.8 | 4.3 | 10.9 |
| Machinery ex Transport | 17.3 | 2.1 | 14.2 | 11.5 | 24.3 | 8.3 |

Tom Moeller
AuthorMore in Author Profile »Prior to joining Haver Analytics in 2000, Mr. Moeller worked as the Economist at Chancellor Capital Management from 1985 to 1999. There, he developed comprehensive economic forecasts and interpreted economic data for equity and fixed income portfolio managers. Also at Chancellor, Mr. Moeller worked as an equity analyst and was responsible for researching and rating companies in the economically sensitive automobile and housing industries for investment in Chancellor’s equity portfolio. Prior to joining Chancellor, Mr. Moeller was an Economist at Citibank from 1979 to 1984. He also analyzed pricing behavior in the metals industry for the Council on Wage and Price Stability in Washington, D.C. In 1999, Mr. Moeller received the award for most accurate forecast from the Forecasters' Club of New York. From 1990 to 1992 he was President of the New York Association for Business Economists. Mr. Moeller earned an M.B.A. in Finance from Fordham University, where he graduated in 1987. He holds a Bachelor of Arts in Economics from George Washington University.
More Economy in Brief


